Market Wrap: Stocks, Bonds, Commodities
Stock futures are near flat Thursday night as investors looked ahead to the second in a pair of closely watched inflation reports this week.
The Dow Jones Industrial Average rose 15.29 points to 37,711.02, the S&P 500 lose 0.07% to 4,780.24 and the Nasdaq Composite add 0.01 points to 14,970.18.
MSCI’s index of Asia-Pacific stocks outside Japan is decline 0.02% to 620.06 levels. The Australian index was lower by 0.10% to 7,498.30. Japanese Nikkei Index asceend 1.50% today.
European stocks were negative on Friday, with the Stoxx Europe 50 Index rose 1.03% to 4,488.25, Germany’s DAX ascend 0.94% to 16,703.88, and France’s CAC advance 1.17% to 7,474.36 and U.K.’s FTSE 100 ad 0.05% to 7,637.91.
Benchmark 10-year U.S. Treasury fell as deman for safe assets ascend again, today 10-year bond yields negative 0.01% to 3.9790.
Oil prices rose nearly 1% on Thursday after Iran seized an oil tanker off the coast of Oman, raising the prospect of escalating conflict in the Middle East.
Spot Brent crude oil ascend 3.23% to $79.91 per barrel. US West Texas Intermediate crude is up 3.42% to $74.49 a barrel.
The yellow metal gold is advance 1.26% to 2,044.60 dollars per ounce.
Market Wrap: Forex
The dollar was down on the day against the euro and the yen on Thursday but off lows reached before data showed that U.S. consumer price inflation came in above economists’ expectations in December, raising some doubts that the Federal Reserve will cut rates as soon as traders expect.
Today, the U.S. dollar index measures the Greenback against a trade-weighted basket of six major currencies, which surged 0.08% to 102.107.
The Euro US Dollar (EUR/USD) is a widely traded pair that is down 0.10% today. This left the pair trading around $1.09600.
The Japanese yen was negative against the U.S. dollar on Friday. Today USD/JPY is slipped 0.07% to the 145.180 level.
Another commodity-related currency positive against the U.S dollar, AUD/USD rose 0.20% to 0.67010, and NZD/USD surged 0.21% to 0.62450 level.
EUR/USD Intraday: Resistance level at 1.09780
Our pivot point is at 1.09780
Preferable Price Action: Take sell positions below pivot level with targets at 1.09590 & 1.09470 in extension.
Alternative Price Action: Above pivot looks for a further upside to 1.09970 & 1.10090.
Comment: RSI is below 50 levels and Pairs below 20MA.
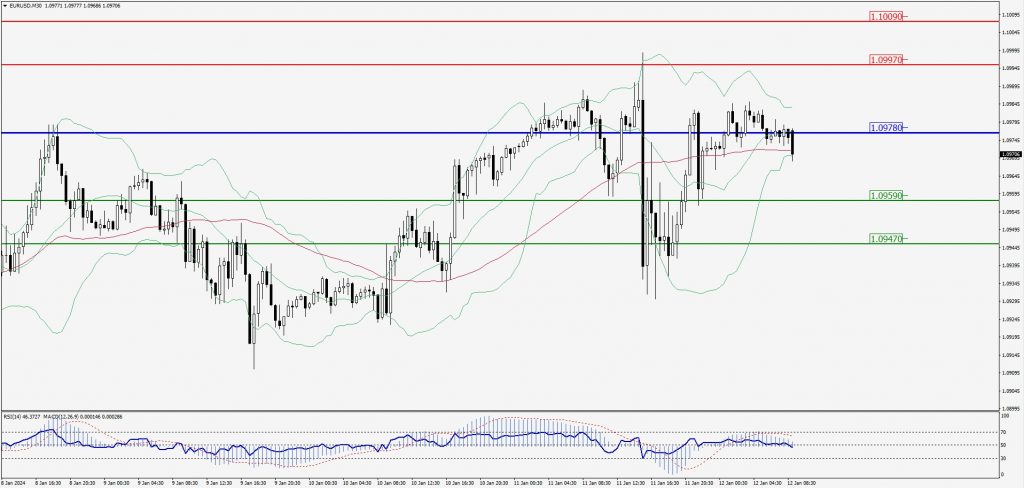
Green Lines Indicate Resistance Levels – Red Lines Indicate Support Levels
Light Blue is a Pivot Point – Black represents the price when the report was produced
GBP/USD Intraday: In a consolidation zone
Our pivot point is at 1.27740
Preferable Price Action: Sell positions below pivot with targets at 1.27460 & 1.27270 in extension.
Alternative Price Action: The price above pivot would call for further upside to 1.28020 & 1.28230.
Comment: RSI is below 50 levels and Pairs below 20MA.
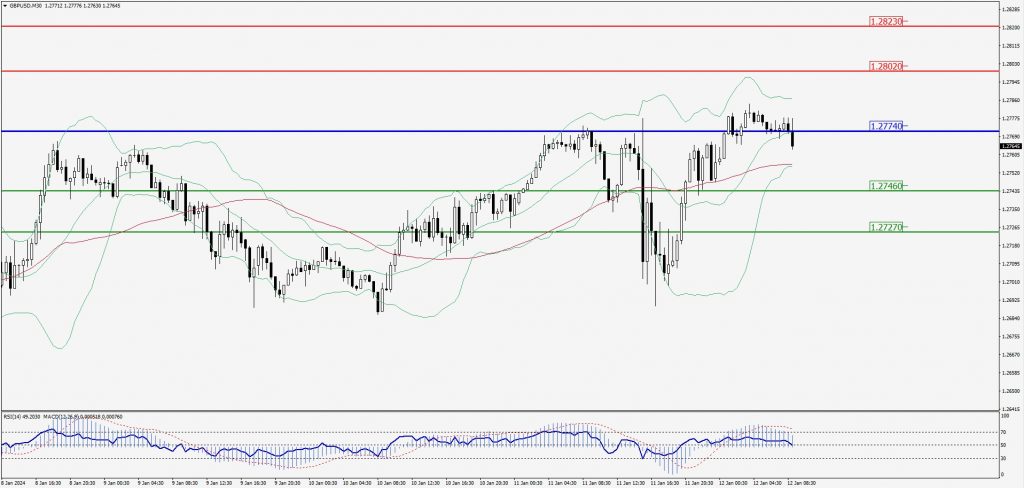
Green Lines Indicate Resistance Levels – Red Lines Indicate Support Levels
Light Blue is a Pivot Point – Black represents the price when the report was produced
USD/JPY Intraday: Trend on the downside
Our pivot point is at 145.440
Preferable Price Action: Sell position below pivot with the target at 144.890 and 144.560 in extension.
Alternative Price Action: The upside breakout of the pivot would call for 145.910 and 146.270.
Comment: MACD is below 50 level and Pairs below 55MA.
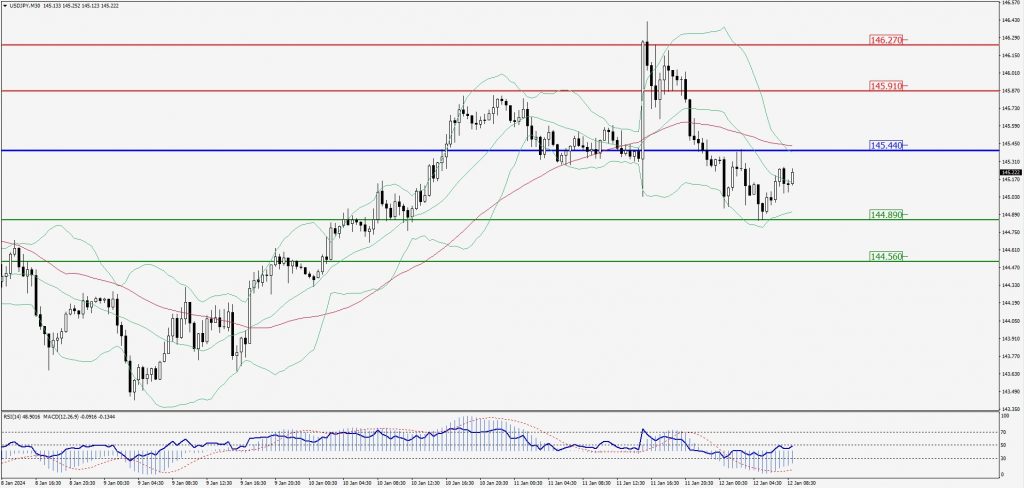
Green Lines Indicate Resistance Levels – Red Lines Indicate Support Levels
Light Blue is a Pivot Point – Black represents the price when the report was produced
AUD/USD Intraday: Trend on the downside
Our pivot point is at 0.67020
Preferable Price Action: Sell positions below pivot with targets at 0.66850 & 0.66750 in extension.
Alternative Price Action: Above pivot looks for a further upside with 0.67160 & 0.67270 as targets.
Comment: RSI is below 50 levels and Pairs below 55MA.
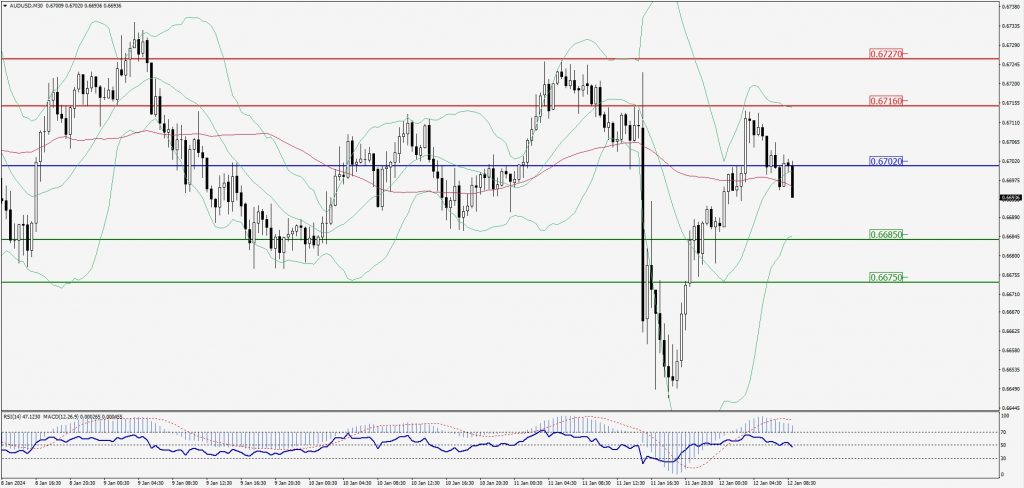
Green Lines Indicate Resistance Levels – Red Lines Indicate Support Levels
Light Blue is a Pivot Point – Black represents the price when the report was produced
CRUDEOIL Intraday: Trend on the upside
Our pivot point is at 73.51
Preferable Price Action: Above pivot buy oil with 74.39 & 74.99 as targets.
Alternative Price Action: Sell crude below pivot with targets at 72.80 and 72.29 in extension.
Comment: MACD is positive territory and Pairs above its 20MA & 55MA.
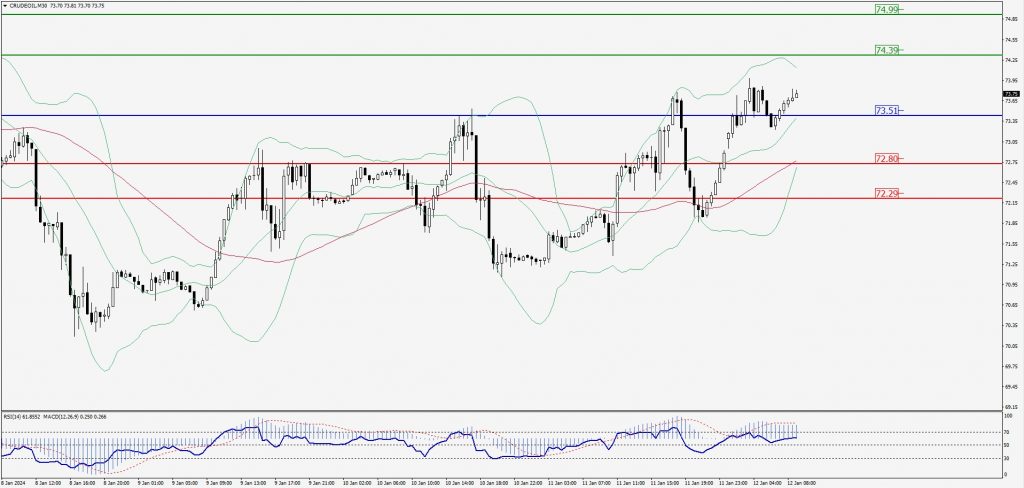
Green Lines Indicate Resistance Levels – Red Lines Indicate Support Levels
Light Blue is a Pivot Point – Black represents the price when the report was produced
XAU/USD Intraday: Support level at 2033.80
Our pivot point is 2033.80
Preferable Price Action: Further upside to 2040.00 and 2044.20.
Alternative Price Action: If the price gives a downside breakout of a pivot, then the price extends to 2028.60 and 2024.70.
Comment: MACD is above 50 level and Pairs above its 20MA & 55MA.
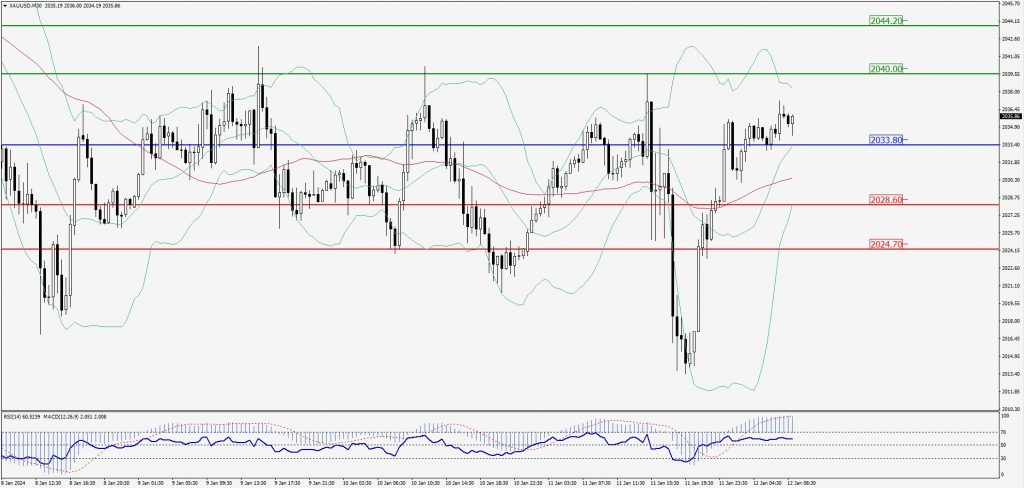
Green Lines Indicate Resistance Levels – Red Lines Indicate Support Levels
Light Blue is a Pivot Point – Black represents the price when the report was produced
Dow Jones Intraday: In a consolidation zone
Our pivot point is 37,714.00
Preferable Price Action: Take sell positions below the pivot with targets at 37,645.00 & 37,596.00.
Alternative Price Action: Above 37,714.00 looks for further upside to 37,779.00 & 37,830.00.
Comment: RSI is below 50 levels.
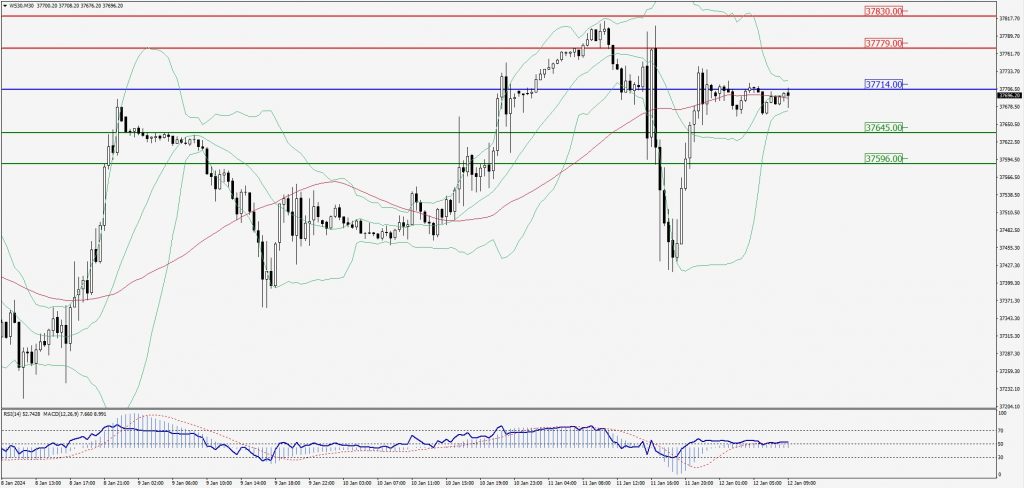
Green Lines Indicate Resistance Levels – Red Lines Indicate Support Levels
Light Blue is a Pivot Point – Black represents the price when the report was produced