Market Wrap: Stocks, Bonds, Commodities
The S&P 500 and Dow lost ground and closed lower on Tuesday, pressured by a modest rise in Treasury yields as investors assessed the timing and size of any Federal Reserve interest rate cuts in 2024 ahead of inflation data this week.
The Dow Jones Industrial Average fell 157.85 points to 37,525.16, the S&P 500 lose 0.15% to 4,756.50 and the Nasdaq Composite add 13.94 points to 14,857.71.
MSCI’s index of Asia-Pacific stocks outside Japan is decline 0.56% to 615.50 levels. The Australian index was lower by 0.69% to 7,468.50. Japanese Nikkei Index asceend 2.08% today.
European stocks were negative on Thursday, with the Stoxx Europe 50 Index rose 0.30% to 4,480.75, Germany’s DAX ascend 0.32% to 16,740.39, and France’s CAC advance 0.28% to 7,447.73 and U.K.’s FTSE 100 subtract 0.10% to 7,676.99.
Benchmark 10-year U.S. Treasury fell as deman for safe assets ascend again, today 10-year bond yields negative 0.68% to 3.9910.
Oil prices rose on January 9 after sliding in the previous session as markets weighed Middle East tensions against demand worries and rising OPEC supply.
Spot Brent crude oil drop 0.17% to $77.46 per barrel. US West Texas Intermediate crude is down 0.19% to $72.10 a barrel.
The yellow metal gold is advance 0.39% to 2,040.80 dollars per ounce.
Market Wrap: Forex
The dollar rose against the euro and yen on Tuesday as traders awaited inflation data on Thursday for clues on when the Federal Reserve is likely to cut rates.
Today, the U.S. dollar index measures the Greenback against a trade-weighted basket of six major currencies, which slipped 0.14% to 102.137.
The Euro US Dollar (EUR/USD) is a widely traded pair that is up 0.17% today. This left the pair trading around $1.09500.
The Japanese yen was negative against the U.S. dollar on Thursday. Today USD/JPY is surged 0.31% to the 144.940 level.
Another commodity-related currency positive against the U.S dollar, AUD/USD rose 0.39% to 0.67080, and NZD/USD surged 0.18% to 0.62490 level.
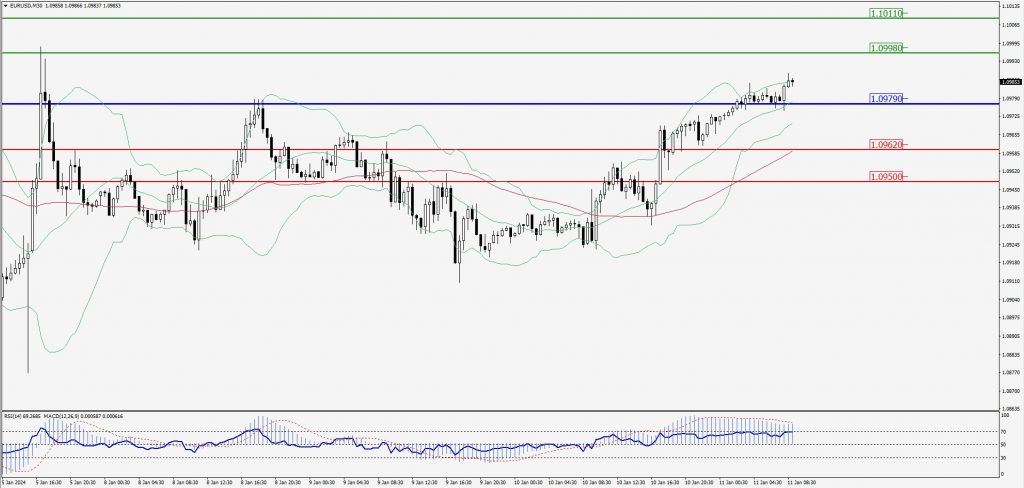
EUR/USD Intraday: Major trend on the upside
Our pivot point is at 1.09790
Preferable Price Action: Take buy positions above pivot level with targets at 1.09980 & 1.10110 in extension.
Alternative Price Action: Below pivot looks for a further downside to 1.09620 & 1.09500.
Comment: RSI is above 50 levels and Pairs above its 20MA & 55MA.
Green Lines Indicate Resistance Levels – Red Lines Indicate Support Levels
Light Blue is a Pivot Point – Black represents the price when the report was produced
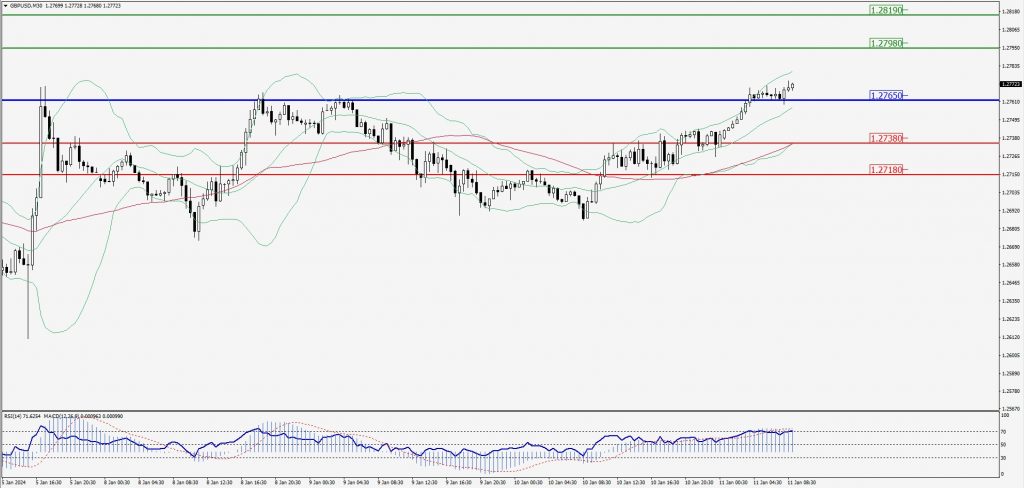
GBP/USD Intraday: Trend on the upside
Our pivot point is at 1.27650
Preferable Price Action: Buy positions above pivot with targets at 1.27980 & 1.28190 in extension.
Alternative Price Action: The price below pivot would call for further downside to 1.27380 & 1.27180.
Comment: RSI is above 50 levels and Pairs above its 20MA & 55MA.
Green Lines Indicate Resistance Levels – Red Lines Indicate Support Levels
Light Blue is a Pivot Point – Black represents the price when the report was produced
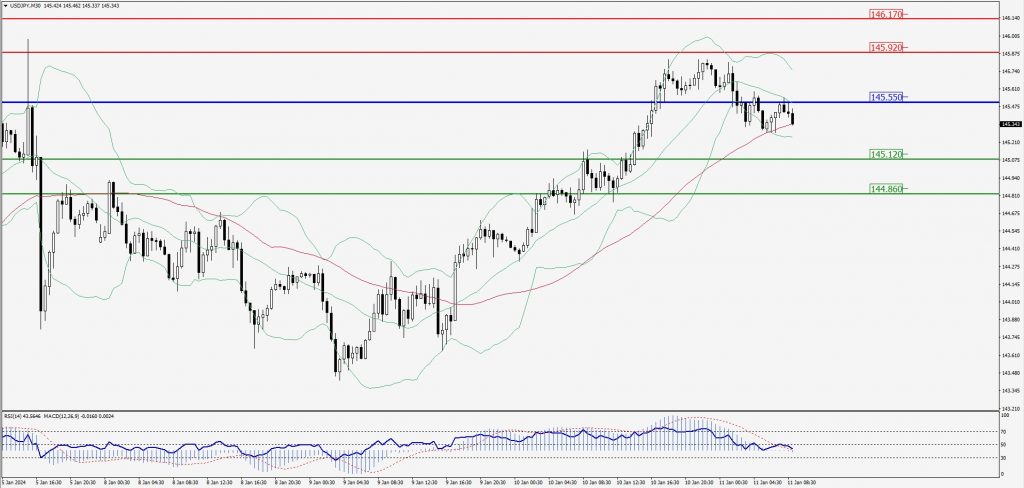
USD/JPY Intraday: Trend on the downside
Our pivot point is at 145.550
Preferable Price Action: Sell position below pivot with the target at 145.120 and 144.860 in extension.
Alternative Price Action: The upside breakout of the pivot would call for 145.920 and 146.170.
Comment: MACD is below 50 level and Pairs below 20MA.
Green Lines Indicate Resistance Levels – Red Lines Indicate Support Levels
Light Blue is a Pivot Point – Black represents the price when the report was produced
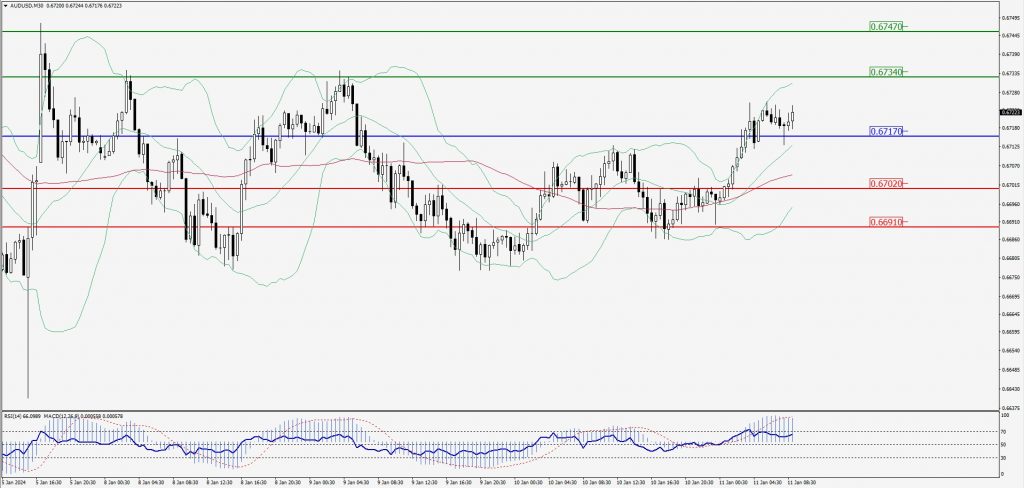
AUD/USD Intraday: Support level at 0.67170
Our pivot point is at 0.67170
Preferable Price Action: Buy positions above pivot with targets at 0.67340 & 0.67470 in extension.
Alternative Price Action: Below pivot looks for a further downside with 0.67020 & 0.66910 as targets.
Comment: RSI is above 50 levels and Pairs above its 20MA & 55MA.
Green Lines Indicate Resistance Levels – Red Lines Indicate Support Levels
Light Blue is a Pivot Point – Black represents the price when the report was produced
CRUDEOIL Intraday: Trend on the upside
Our pivot point is at 71.77
Preferable Price Action: Above pivot buy oil with 72.48 & 73.05 as targets.
Alternative Price Action: Sell crude below pivot with targets at 71.18 and 70.71 in extension.
Comment: MACD is positive territory and Pairs above 20MA.
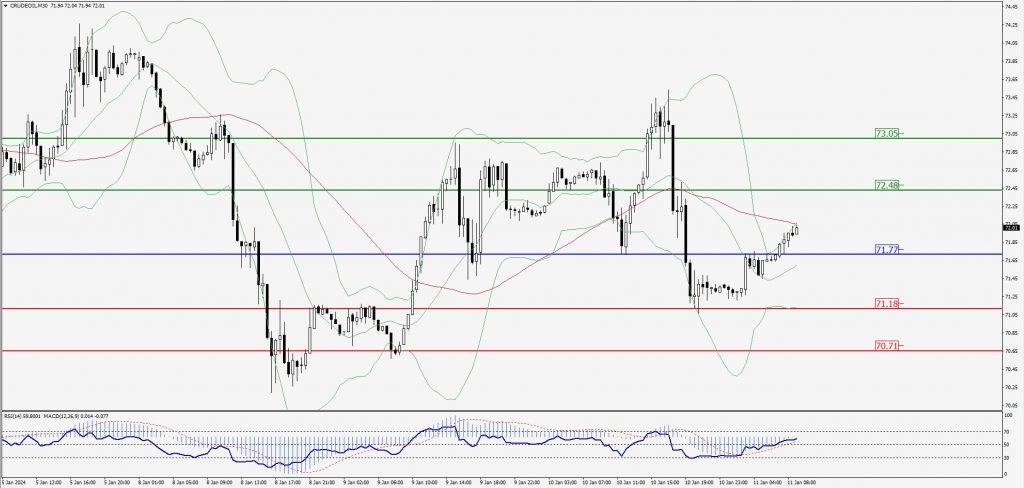
Green Lines Indicate Resistance Levels – Red Lines Indicate Support Levels
Light Blue is a Pivot Point – Black represents the price when the report was produced
XAU/USD Intraday: Major trend on the upside
Our pivot point is 2032.50
Preferable Price Action: Further upside to 2041.10 and 2047.40.
Alternative Price Action: If the price gives a downside breakout of a pivot, then the price extends to 2025.30 and 2019.80.
Comment: MACD is above 50 level and Pairs above its 20MA & 55MA.
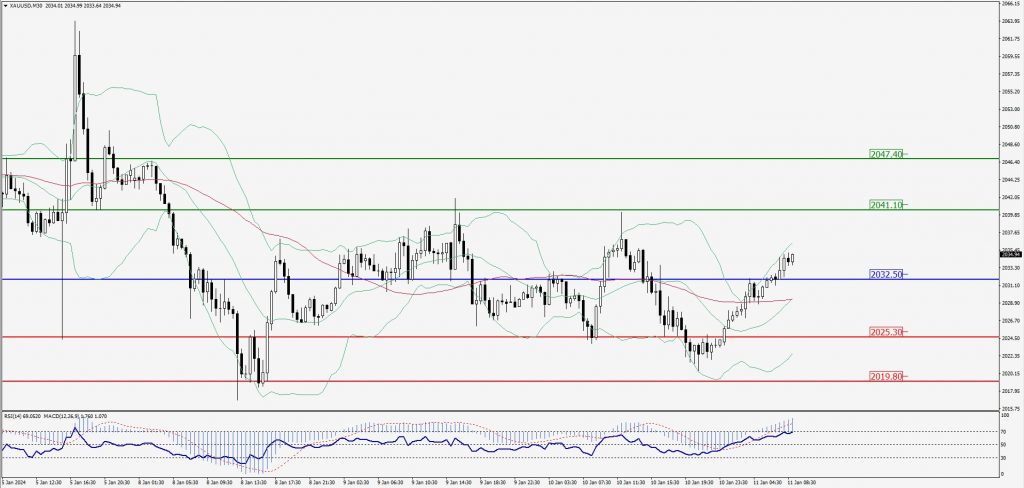
Green Lines Indicate Resistance Levels – Red Lines Indicate Support Levels
Light Blue is a Pivot Point – Black represents the price when the report was produced
Dow Jones Intraday: Trend on the downside
Our pivot point is 37,511.00
Preferable Price Action: Take sell positions below the pivot with targets at 37,430.00 & 37,372.00.
Alternative Price Action: Above 37,511.00 looks for further upside to 37,585.00 & 37,639.00.
Comment: RSI is below 50 levels and Pairs below its 20MA & 55MA.
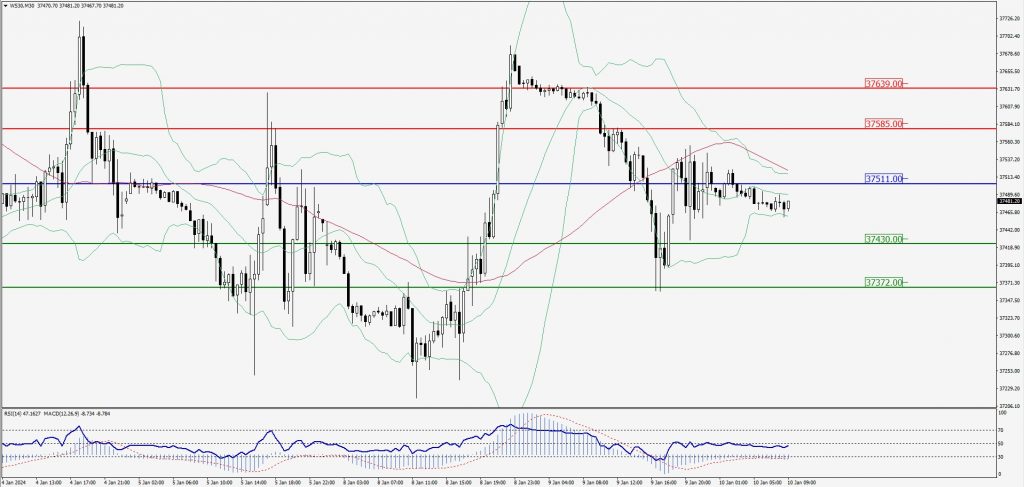
Green Lines Indicate Resistance Levels – Red Lines Indicate Support Levels
Light Blue is a Pivot Point – Black represents the price when the report was produced