Market Wrap: Stocks, Bonds, Commodities
U.S. stocks were higher after the close on Monday, as gains in the Industrials, Basic Materials and Consumer Services sectors led shares higher.
The Dow Jones Industrial Average rose 157.06 points to 36,404.93, the S&P 500 gain 0.39% to 4,622.44 and the Nasdaq Composite add 28.51 points to 14,432.49.
MSCI’s index of Asia-Pacific stocks outside Japan is advance 0.56% to 613.92 levels. The Australian index was higher by 0.50% to 7,235.49. Japanese Nikkei Index ascend 0.10% today.
European stocks were positive on Tuesday, with the Stoxx Europe 50 Index rose 0.27% to 4,552.35, Germany’s DAX ascend 0.19% to 16,826.05, and France’s CAC advance 0.21% to 7,567.74 and U.K.’s FTSE 100 add 0.39% to 7,574.58.
Benchmark 10-year U.S. Treasury fell as deman for safe assets ascend again, today 10-year bond yields negative 1.00% to 4.1960.
Oil prices held steady on Tuesday ahead of key interest rate policy and inflation data announcements, and amid doubts that production cuts by OPEC+ next year would offset crude oversupply and weaker fuel demand growth.
Spot Brent crude oil ascend 0.38% to $76.32 per barrel. US West Texas Intermediate crude is up 0.42% to $71.62 a barrel.
The yellow metal gold is decline 0.23% to 2,000.55 dollars per ounce.
Market Wrap: Forex
The dollar dipped in European trade on Thursday, as markets remained on edge before key U.S. labor data, while the yen appreciated as Bank of Japan Governor Kazuo Ueda offered more cues on a potential pivot away from the central bank’s ultra-dovish stance.
Today, the U.S. dollar index measures the Greenback against a trade-weighted basket of six major currencies, which slipped 0.23% to 103.477.
The Euro US Dollar (EUR/USD) is a widely traded pair that is up 0.22% today. This left the pair trading around $1.07860.
The Japanese yen was negative against the U.S. dollar on Tuesday. Today USD/JPY is slipped 0.47% to the 145.470 level.
Another commodity-related currency positive against the U.S dollar, AUD/USD rose 0.41% to 0.65920, and NZD/USD surged 0.42% to 0.61490 level.
EUR/USD Intraday: Trend on the upside
Our pivot point is at 1.07710
Preferable Price Action: Take buy positions above pivot level with targets at 1.07880 & 1.08000 in extension.
Alternative Price Action: Below pivot looks for a further downside to 1.07560 & 1.07450.
Comment: RSI is above 50 levels and Pairs above its 20MA & 55MA.
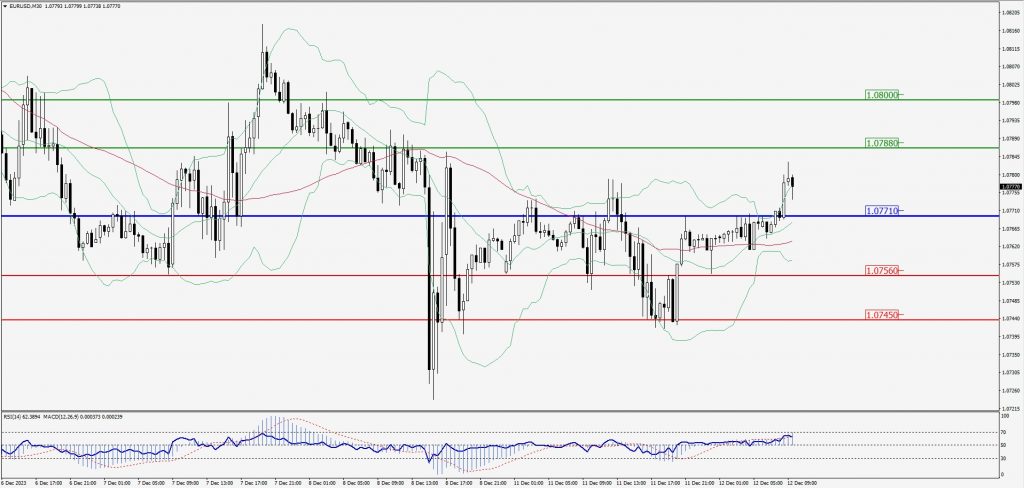
Green Lines Indicate Resistance Levels – Red Lines Indicate Support Levels
Light Blue is a Pivot Point – Black represents the price when the report was produced
GBP/USD Intraday: In a consolidation zone
Our pivot point is at 1.25580
Preferable Price Action: Buy positions above pivot with targets at 1.25810 & 1.25960 in extension.
Alternative Price Action: The price below pivot would call for further downside to 1.25420 & 1.25290.
Comment: RSI is at 50 levels and Pairs above 55MA.
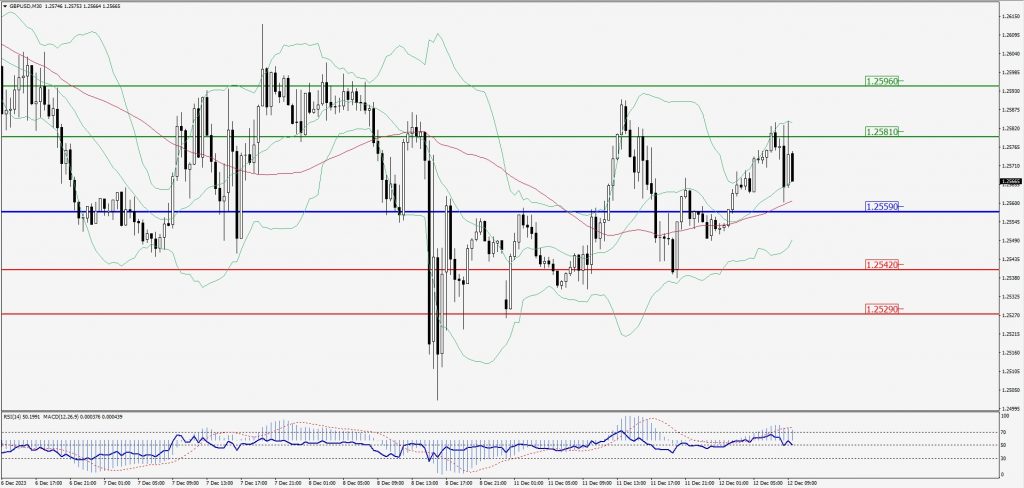
Green Lines Indicate Resistance Levels – Red Lines Indicate Support Levels
Light Blue is a Pivot Point – Black represents the price when the report was produced
USD/JPY Intraday: Trend on the downside
Our pivot point is at 145.850
Preferable Price Action: Sell position below pivot with the target at 144.760 and 144.150 in extension.
Alternative Price Action: The upside breakout of the pivot would call for 146.890 and 147.560.
Comment: MACD is below 50 level and Pairs below its 20MA & 55MA.
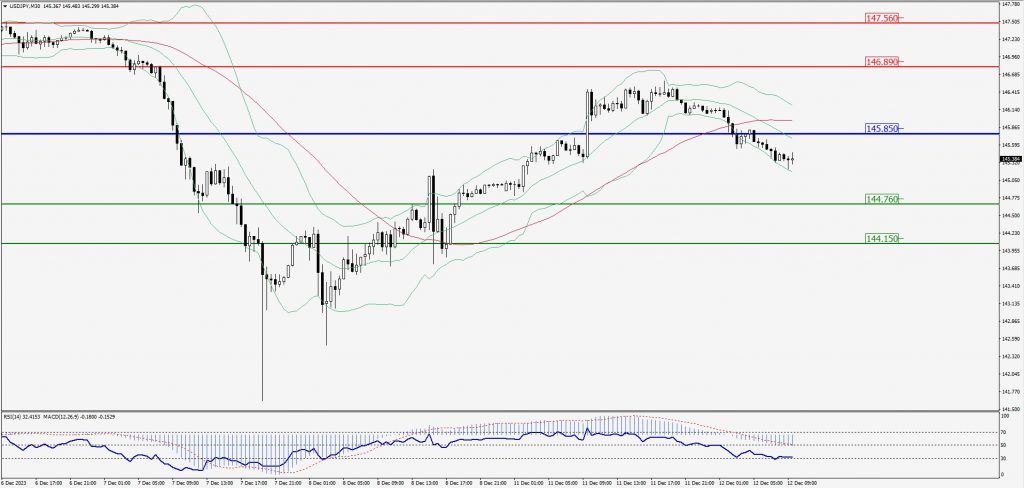
Green Lines Indicate Resistance Levels – Red Lines Indicate Support Levels
Light Blue is a Pivot Point – Black represents the price when the report was produced
AUD/USD Intraday: Major trend on the upside
Our pivot point is at 0.65910
Preferable Price Action: Buy positions above pivot with targets at 0.66090 & 0.66210 in extension.
Alternative Price Action: Below pivot looks for a further downside with 0.65750 & 0.65630 as targets.
Comment: RSI is above 50 levels and Pairs above its 20MA & 55MA.
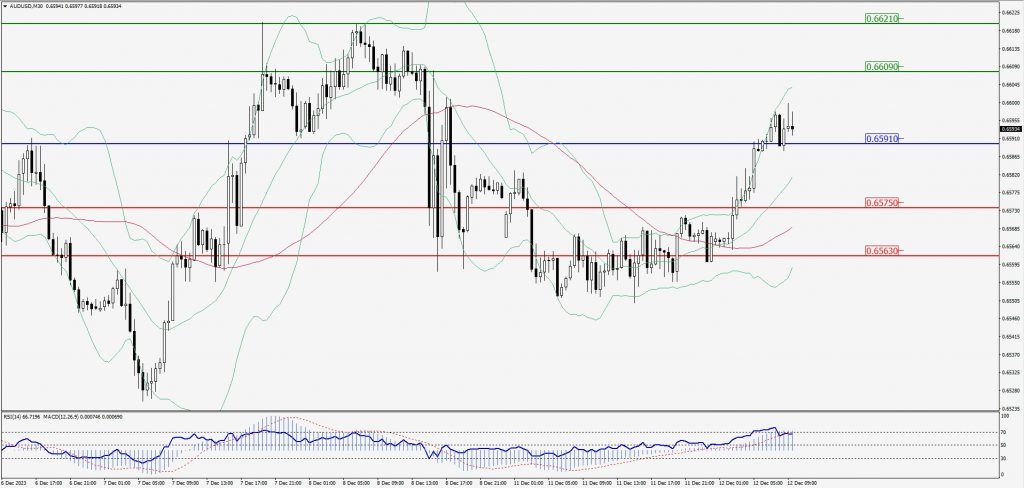
Green Lines Indicate Resistance Levels – Red Lines Indicate Support Levels
Light Blue is a Pivot Point – Black represents the price when the report was produced
CRUDEOIL Intraday: Trend on the upside
Our pivot point is at 71.72
Preferable Price Action: Above pivot buy oil with 72.68 & 73.32 as targets.
Alternative Price Action: Sell crude below pivot with targets at 70.89 and 70.33 in extension.
Comment: MACD is positive territory and Pairs above its 20MA & 55MA.
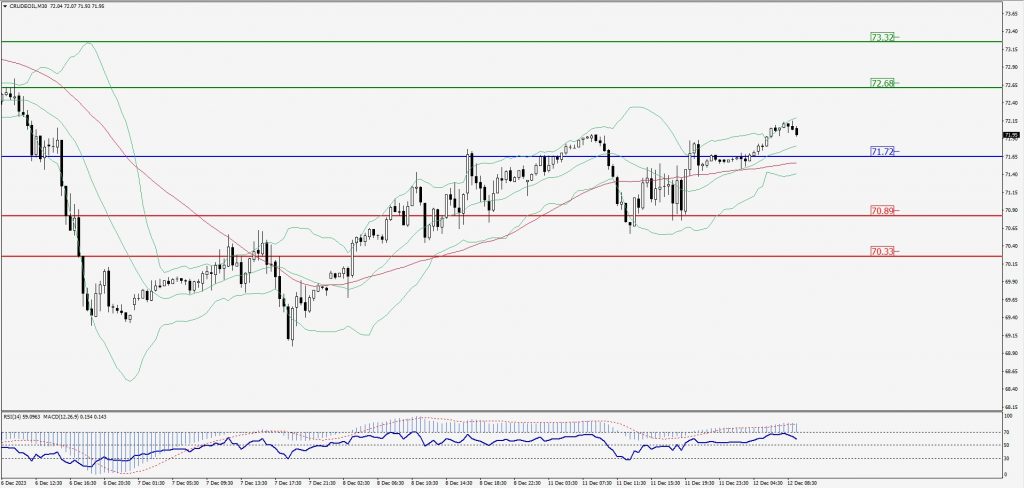
Green Lines Indicate Resistance Levels – Red Lines Indicate Support Levels
Light Blue is a Pivot Point – Black represents the price when the report was produced
XAU/USD Intraday: Trend on the upside
Our pivot point is 1985.90
Preferable Price Action: Further downside to 1995.50 and 2003.10.
Alternative Price Action: If the price gives a downside breakout of a pivot, then the price extends to 1976.00 and 1969.70.
Comment: MACD is above 50 level and Pairs above 20MA.
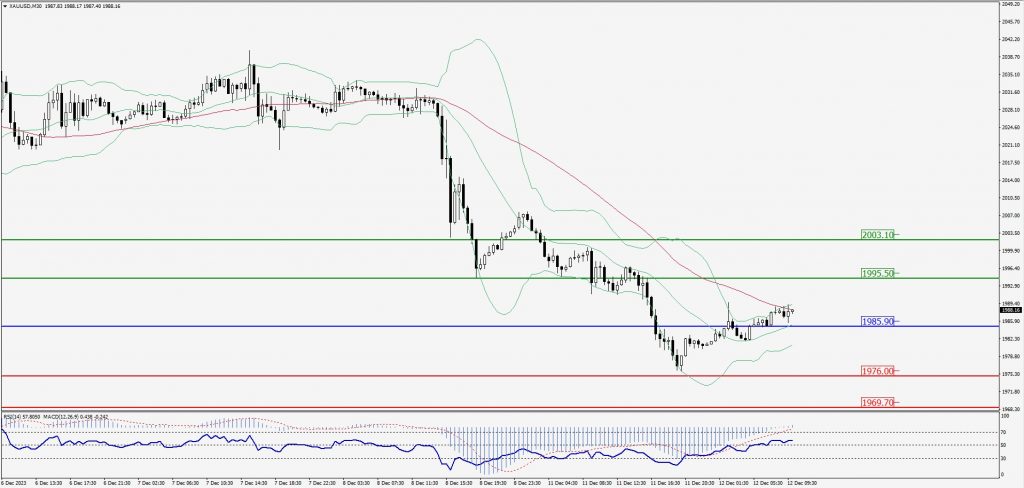
Green Lines Indicate Resistance Levels – Red Lines Indicate Support Levels
Light Blue is a Pivot Point – Black represents the price when the report was produced
Dow Jones Intraday: Trend on the upside
Our pivot point is 36,412.00
Preferable Price Action: Take buy positions above the pivot with targets at 36,500.00 & 36,563.00.
Alternative Price Action: Below 36,412.00 looks for further downside to 36,330.00 & 36,273.00.
Comment: RSI is above 50 levels and Pairs above 55MA.
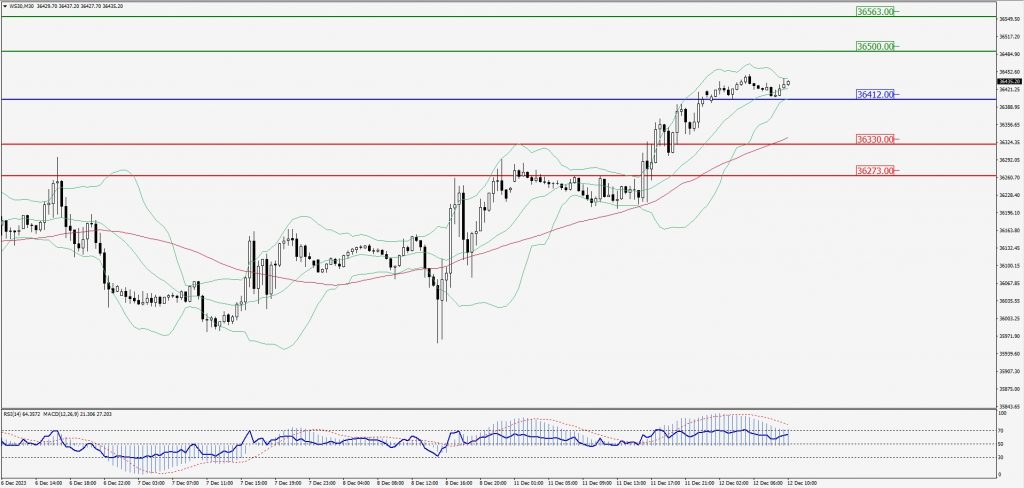
Green Lines Indicate Resistance Levels – Red Lines Indicate Support Levels
Light Blue is a Pivot Point – Black represents the price when the report was produced