Market Wrap: Stocks, Bonds, Commodities
US stock futures were slightly higher on Sunday night as investors await this week’s final Federal Reserve meeting of 2023 for any signals on when central bankers will begin to cut interest rates.
The Dow Jones Industrial Average rose 130.49 points to 36,247.87, the S&P 500 gain 0.41% to 4,604.37 and the Nasdaq Composite add 63.98 points to 14,403.97.
MSCI’s index of Asia-Pacific stocks outside Japan is decline 0.38% to 609.65 levels. The Australian index was higher by 0.06% to 7,199.00. Japanese Nikkei Index ascend 1.56% today.
European stocks were mixed on Monday, with the Stoxx Europe 50 Index rose 0.02% to 4,522.25, Germany’s DAX drop 0.09% to 16,7544.04, and France’s CAC advance 0.23% to 7,544.04 and U.K.’s FTSE 100 add 0.17% to 7,527.96.
Benchmark 10-year U.S. Treasury fell as deman for safe assets ascend again, today 10-year bond yields positive 0.17% to 4.2540.
Oil prices rallied Friday, but still booked the seventh straight week of losses as record production and demand worries weigh on prices.
Spot Brent crude oil ascend 0.17% to $75.97 per barrel. US West Texas Intermediate crude is up 0.17% to $75.31 a barrel.
The yellow metal gold is decline 0.15% to 2,011.35 dollars per ounce.
Market Wrap: Forex
The U.S. dollar edged lower in early European trade Wednesday, but remained near a two-week high, ahead of key employment data, while the euro headed lower after weak German factory orders.
Today, the U.S. dollar index measures the Greenback against a trade-weighted basket of six major currencies, which surged 0.07% to 103.707.
The Euro US Dollar (EUR/USD) is a widely traded pair that is up 0.05% today. This left the pair trading around $1.07660.
The Japanese yen was negative against the U.S. dollar on Monday. Today USD/JPY is surged 0.87% to the 146.190 level.
Another commodity-related currency negative against the U.S dollar, AUD/USD fell 0.35% to 0.65540, and NZD/USD slipped 0.20% to 0.61090 level.
EUR/USD Intraday: In a consolidation zone
Our pivot point is at 1.07630
Preferable Price Action: Take buy positions above pivot level with targets at 1.07860 & 1.08030 in extension.
Alternative Price Action: Below pivot looks for a further downside to 1.07410 & 1.07270.
Comment: RSI is at 50 levels and Pairs above 20MA.
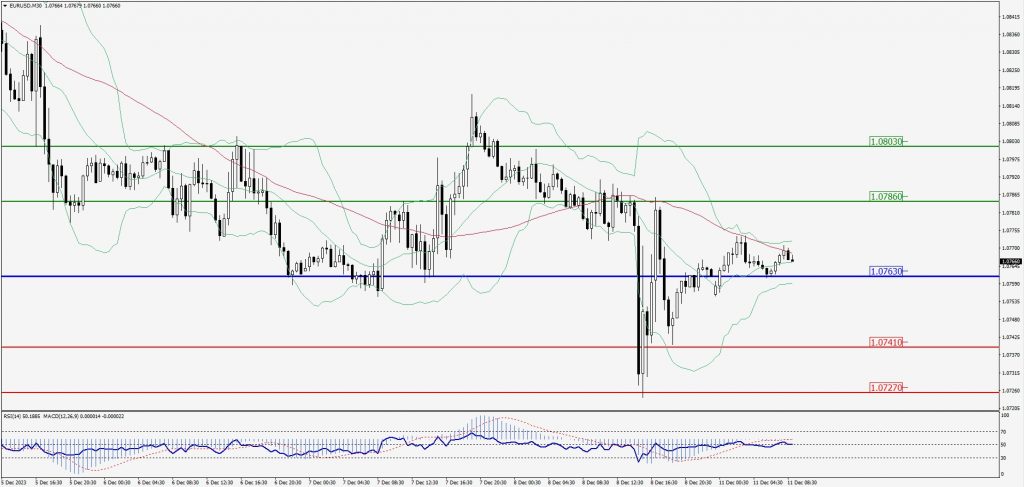
Green Lines Indicate Resistance Levels – Red Lines Indicate Support Levels
Light Blue is a Pivot Point – Black represents the price when the report was produced
GBP/USD Intraday: Trend on the downside
Our pivot point is at 1.25510
Preferable Price Action: Sell positions below pivot with targets at 1.25200 & 1.25010 in extension.
Alternative Price Action: The price above pivot would call for further upside to 1.25810 & 1.26030.
Comment: RSI is below 50 levels and Pairs below 55MA.
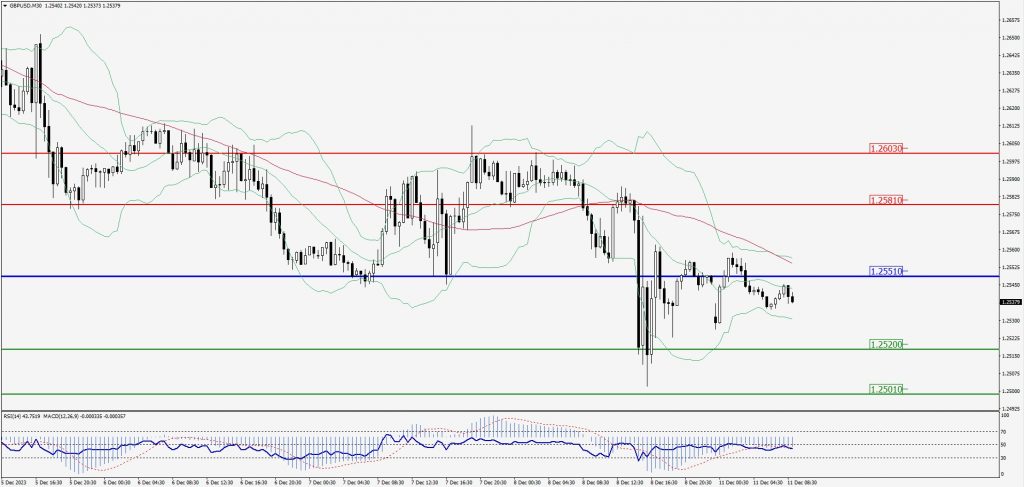
Green Lines Indicate Resistance Levels – Red Lines Indicate Support Levels
Light Blue is a Pivot Point – Black represents the price when the report was produced
USD/JPY Intraday: Trend on the upside
Our pivot point is at 145.210
Preferable Price Action: Buy position above pivot with the target at 146.240 and 146.880 in extension.
Alternative Price Action: The downside breakout of the pivot would call for 144.270 and 143.660.
Comment: MACD is above 50 level and Pairs above its 20MA & 55MA.
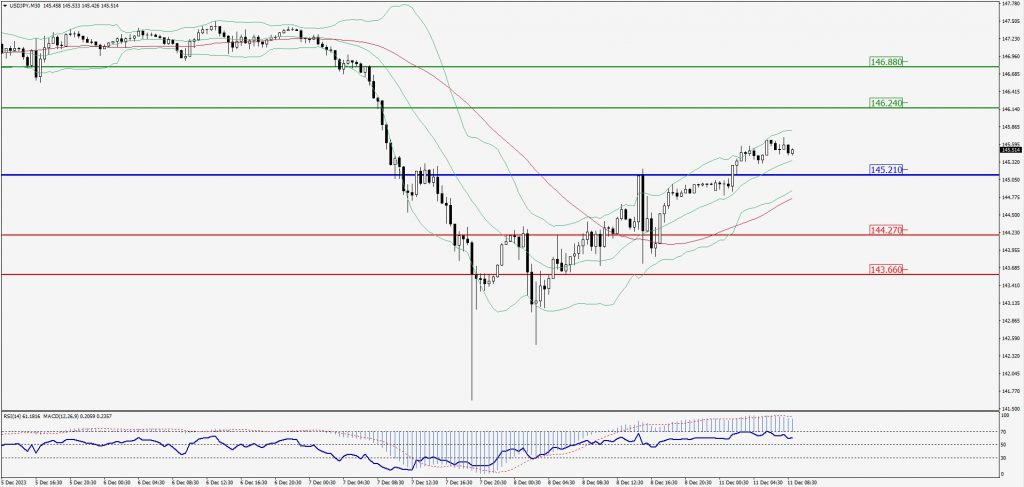
Green Lines Indicate Resistance Levels – Red Lines Indicate Support Levels
Light Blue is a Pivot Point – Black represents the price when the report was produced
AUD/USD Intraday: Trend on the downside
Our pivot point is at 0.65680
Preferable Price Action: Sell positions below pivot with targets at 0.65490 & 0.65380 in extension.
Alternative Price Action: Above pivot looks for a further upside with 0.65830 & 0.65940 as targets.
Comment: RSI is below 50 levels and Pairs below its 20MA & 55MA.
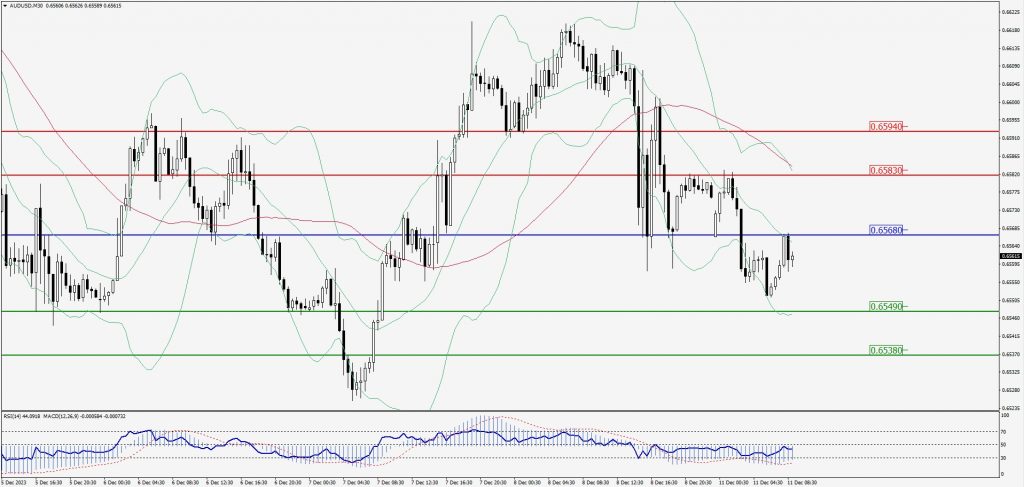
Green Lines Indicate Resistance Levels – Red Lines Indicate Support Levels
Light Blue is a Pivot Point – Black represents the price when the report was produced
CRUDEOIL Intraday: Major trend on the upside
Our pivot point is at 71.72
Preferable Price Action: Above pivot buy oil with 72.68 & 73.32 as targets.
Alternative Price Action: Sell crude below pivot with targets at 70.89 and 70.33 in extension.
Comment: MACD is positive territory and Pairs above its 20MA & 55MA.
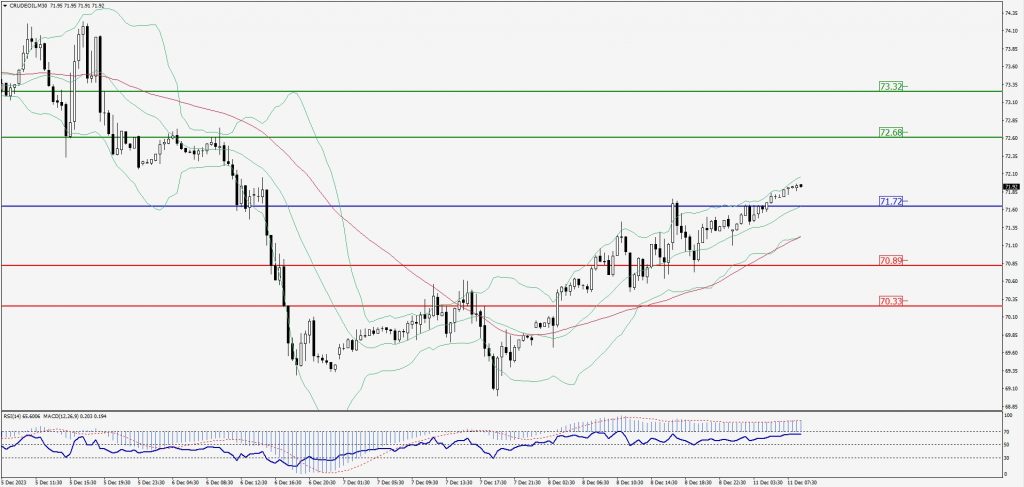
Green Lines Indicate Resistance Levels – Red Lines Indicate Support Levels
Light Blue is a Pivot Point – Black represents the price when the report was produced
XAU/USD Intraday: Trend on the downside
Our pivot point is 2003.20
Preferable Price Action: Further downside to 1990.90 and 1983.80.
Alternative Price Action: If the price gives an upside breakout of a pivot, then the price extends to 2013.10 and 2020.30.
Comment: MACD is below 50 level and Pairs below 55MA.
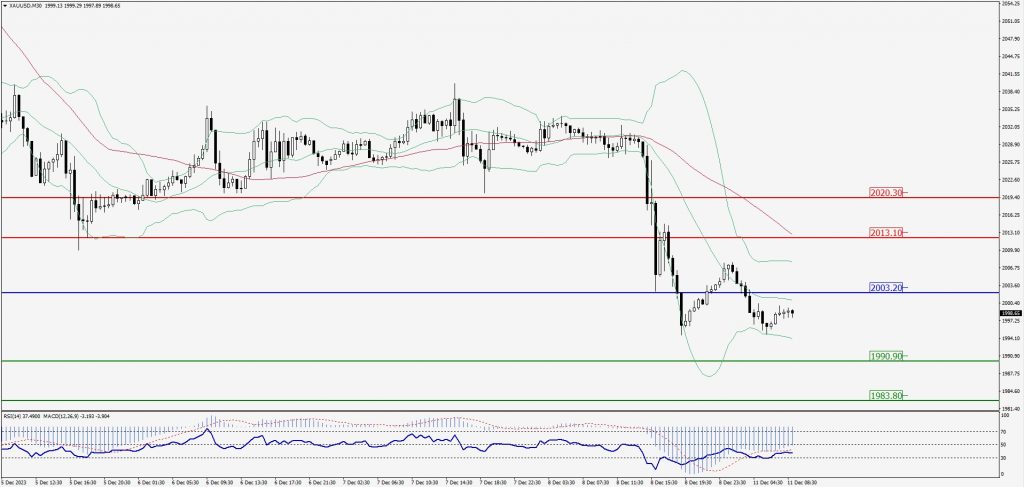
Green Lines Indicate Resistance Levels – Red Lines Indicate Support Levels
Light Blue is a Pivot Point – Black represents the price when the report was produced
Dow Jones Intraday: Trend on the upside
Our pivot point is 36,228.00
Preferable Price Action: Take buy positions above the pivot with targets at 36,293.00 & 36,330.00.
Alternative Price Action: Below 36,228.00 looks for further downside to 36,172.00 & 36,137.00.
Comment: RSI is above 50 levels and Pairs above 55MA.
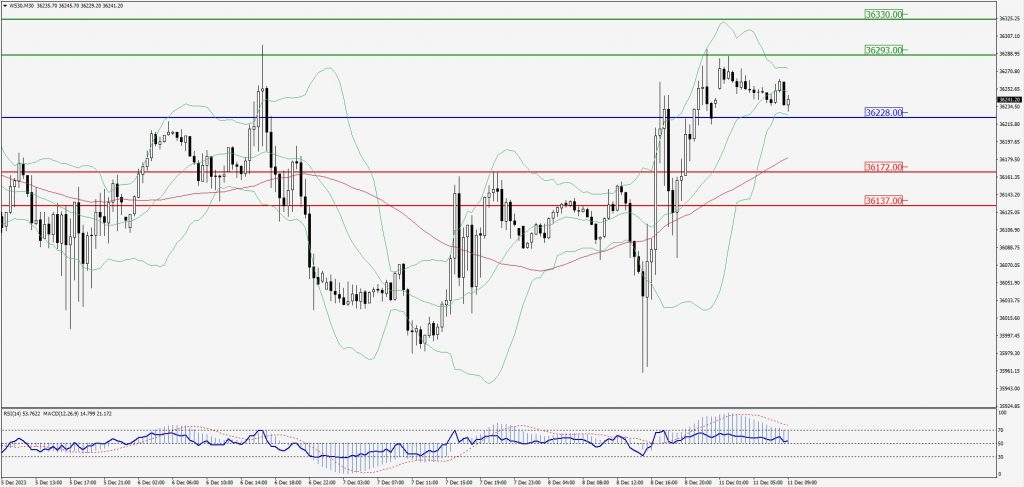
Green Lines Indicate Resistance Levels – Red Lines Indicate Support Levels
Light Blue is a Pivot Point – Black represents the price when the report was produced