Market Wrap: Stocks, Bonds, Commodities
The Dow Jones Industrial Average rallied Thursday to a new high for the year, as more cooling inflation data and strong Salesforce earnings capped the benchmark’s best month since October 2022.
The Dow Jones Industrial Average rose 520.47 points to 35,950.89, the S&P 500 gain 0.38% to 4,567.80 and the Nasdaq Composite subtract 32.27 points to 14,226.22.
MSCI’s index of Asia-Pacific stocks outside Japan is decline 0.62% to 616.92 levels. The Australian index was lower by 0.20% to 7,073.20. Japanese Nikkei Index drop 0.11% today.
European stocks were positive on Friday, with the Stoxx Europe 50 Index rose 0.77% to 4,416.25, Germany’s DAX ascend 0.82% to 16,166.45, and France’s CAC advance 0.58% to 7,352.41 and U.K.’s FTSE 100 add 0.74% to 7,509.97.
Benchmark 10-year U.S. Treasury fell as deman for safe assets ascend again, today 10-year bond yields negative 1.02% to 4.3050.
U.S. crude declined Friday, erasing early gains, as traders grew more convinced that OPEC+, a group composed of OPEC plus its oil-producing allies, will not deliver on promised output cuts.
Spot Brent crude oil drop 0.47% to $80.47 per barrel. US West Texas Intermediate crude is down 0.46% to $75.61 a barrel.
The yellow metal gold is advance 0.56% to 2,049.60 dollars per ounce.
Market Wrap: Forex
The U.S. dollar sank to its lowest in more than three months on Tuesday as investors continued to take the view that growth in the world’s largest economy is starting to slow down, with the market starting to price in a rate cut by the first half of the year.
Today, the U.S. dollar index measures the Greenback against a trade-weighted basket of six major currencies, which slipped 0.56% to 103.247.
The Euro US Dollar (EUR/USD) is a widely traded pair that is up 0.13% today. This left the pair trading around $1.08990.
The Japanese yen was negative against the U.S. dollar on Friday. Today USD/JPY is slipped 0.27% to the 147.800 level.
Another commodity-related currency positive against the U.S dollar, AUD/USD rose 0.41% to 0.66320, and NZD/USD surged 0.44% to 0.61800 level.
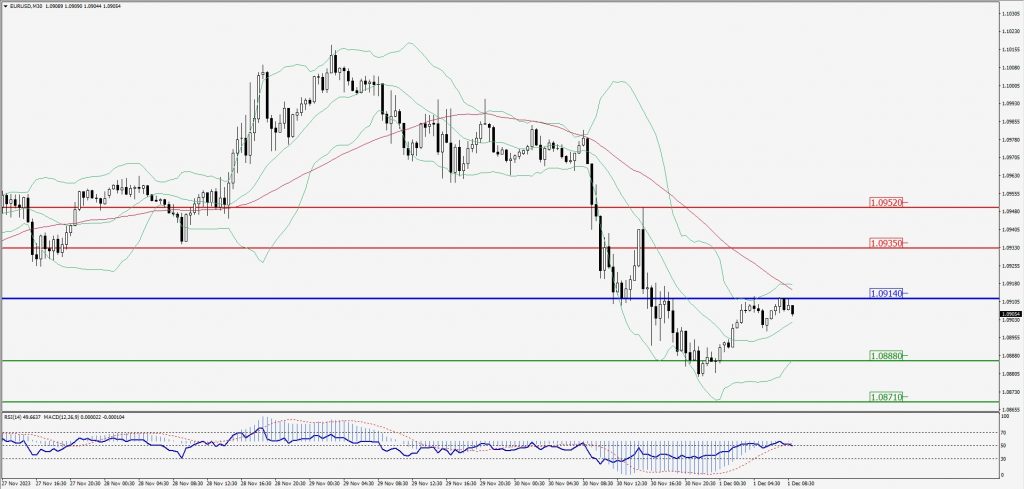
EUR/USD Intraday: Resistance level at 1.09140
Our pivot point is at 1.09140
Preferable Price Action: Take sell positions below pivot level with targets at 1.08880 & 1.08710 in extension.
Alternative Price Action: Above pivot looks for a further upside to 1.09350 & 1.09520.
Comment: RSI is at 50 levels and Pairs below 55MA.
Green Lines Indicate Resistance Levels – Red Lines Indicate Support Levels
Light Blue is a Pivot Point – Black represents the price when the report was produced
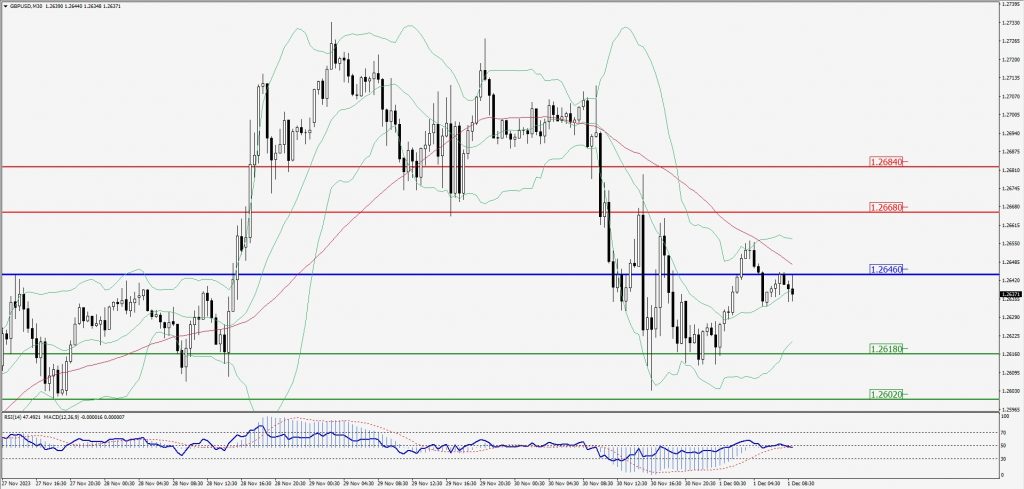
GBP/USD Intraday: Trend on the downside
Our pivot point is at 1.26460
Preferable Price Action: Sell positions below pivot with targets at 1.26180 & 1.26020 in extension.
Alternative Price Action: The price above pivot would call for further upside to 1.26680 & 1.26840.
Comment: RSI is below 50 levels and Pairs below 55MA.
Green Lines Indicate Resistance Levels – Red Lines Indicate Support Levels
Light Blue is a Pivot Point – Black represents the price when the report was produced
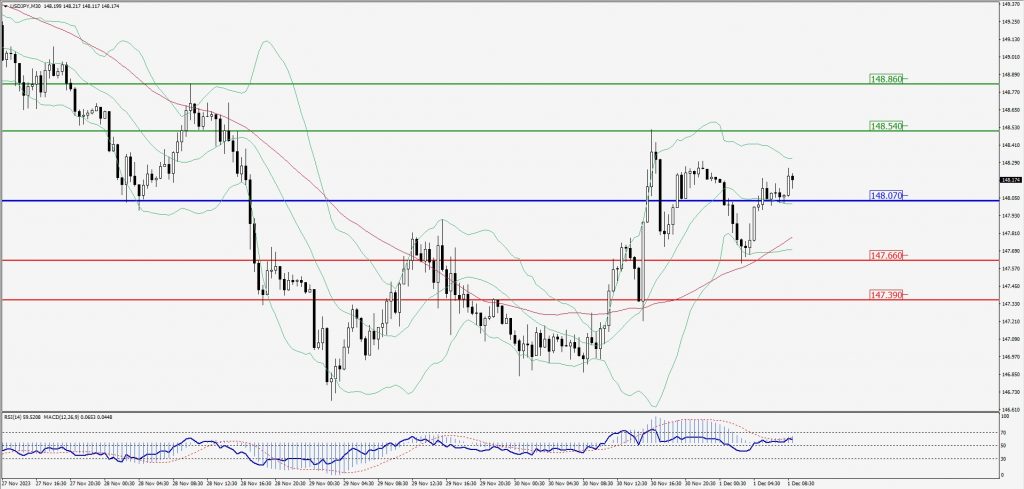
USD/JPY Intraday: Trend on the upside
Our pivot point is at 148.070
Preferable Price Action: Buy position above pivot with the target at 148.540 and 148.860 in extension.
Alternative Price Action: The downside breakout of the pivot would call for 147.660 and 147.390.
Comment: MACD is above 50 level and Pairs above its 20MA & 55MA.
Green Lines Indicate Resistance Levels – Red Lines Indicate Support Levels
Light Blue is a Pivot Point – Black represents the price when the report was produced
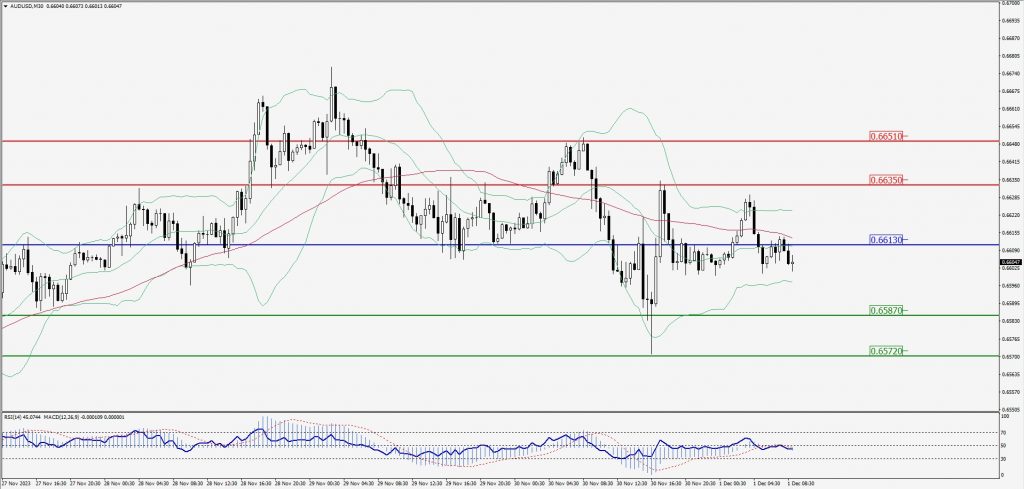
AUD/USD Intraday: Trend on the downside
Our pivot point is at 0.66130
Preferable Price Action: Sell positions below pivot with targets at 0.6580 & 0.65720 in extension.
Alternative Price Action: Above pivot looks for a further upside with 0.66350 & 0.66510 as targets.
Comment: RSI is below 50 levels and Pairs below its 20MA & 55MA.
Green Lines Indicate Resistance Levels – Red Lines Indicate Support Levels
Light Blue is a Pivot Point – Black represents the price when the report was produced
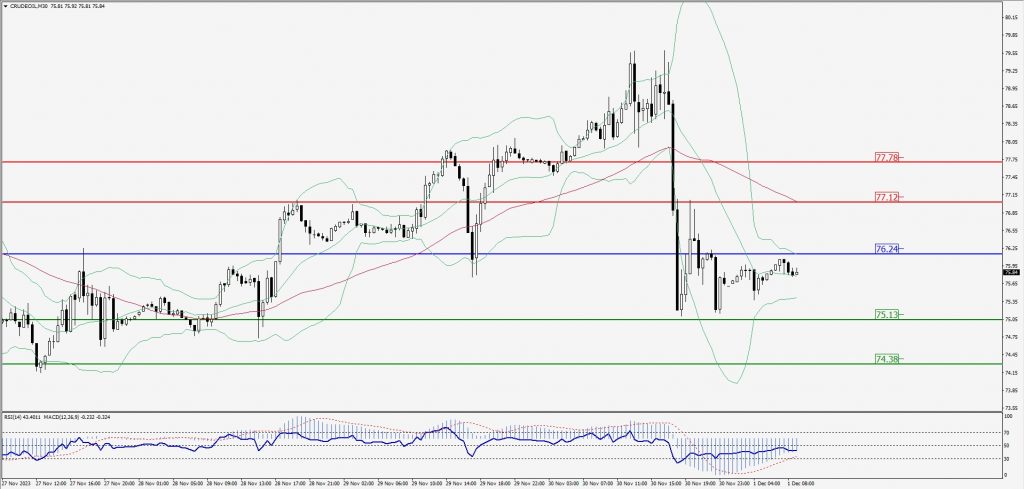
CRUDEOIL Intraday: Trend on the downside
Our pivot point is at 76.24
Preferable Price Action: Below pivot sell oil with 75.13 & 74.38 as targets.
Alternative Price Action: Buy crude above pivot with targets at 77.12 and 77.78 in extension.
Comment: MACD is negative territory and Pairs below 55MA.
Green Lines Indicate Resistance Levels – Red Lines Indicate Support Levels
Light Blue is a Pivot Point – Black represents the price when the report was produced
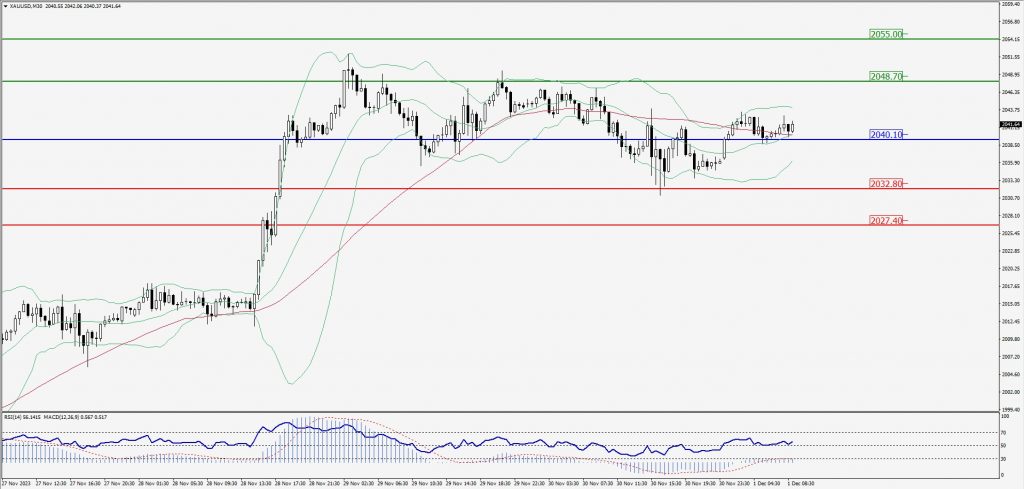
XAU/USD Intraday: Support level at 2040.70
Our pivot point is 2040.70
Preferable Price Action: Further upside to 2048.70 and 2055.00.
Alternative Price Action: If the price gives a downside breakout of a pivot, then the price extends to 2032.80 and 2027.40.
Comment: MACD is above 50 level and Pairs above 55MA.
Green Lines Indicate Resistance Levels – Red Lines Indicate Support Levels
Light Blue is a Pivot Point – Black represents the price when the report was produced
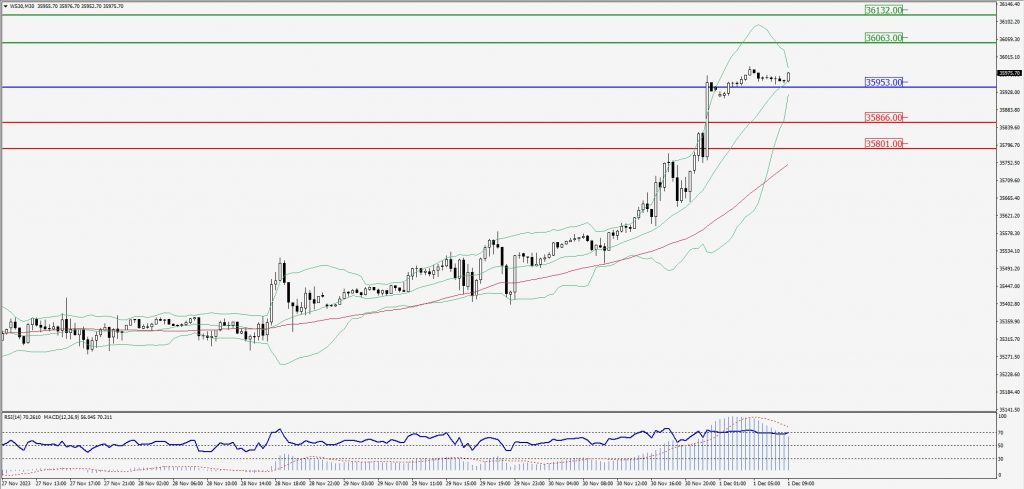
Dow Jones Intraday: Trend on the upside
Our pivot point is 35,953.00
Preferable Price Action: Take buy positions above the pivot with targets at 36,063.00 & 36,132.00.
Alternative Price Action: Below 35,953.00 looks for further downside to 35,866.00 & 35,801.00.
Comment: RSI is above 50 levels and Pairs above its 20MA & 55MA.
Green Lines Indicate Resistance Levels – Red Lines Indicate Support Levels
Light Blue is a Pivot Point – Black represents the price when the report was produced