Market Wrap: Stocks, Bonds, Commodities
Major US stock indices ended sharply higher on Monday as investors were optimistic about the start of the earnings season, while transportation and small-cap shares also jumped.
The Dow Jones Industrial Average rose 314.25 points to 33,984.54, the S&P 500 gain 1.06% to 4,373.63 and the Nasdaq Composite add 160.75 points to 13,567.98.
MSCI’s index of Asia-Pacific stocks outside Japan is advance 0.57% to 605.54 levels. The Australian index was higher by 0.42% to 7,056.98. Japanese Nikkei Index ascend 1.20% today.
European stocks were positive on Tuesday, with the Stoxx Europe 50 Index rose 0.01% to 4,150.15, Germany’s DAX ascend 0.03% to 15,242.35, and France’s CAC advance 0.09% to 7,028.67 and U.K.’s FTSE 100 add 0.37% to 7,659.18.
Benchmark 10-year U.S. Treasury fell as demand for safe assets ascend again, today 10-year bond yields positive 0.89% to 4.7520.
Oil prices steadied on Tuesday after a more than $1 slide on Monday amid hopes the U.S. would ease sanctions on producer Venezuela and as Washington stepped up efforts to prevent an escalation of the war between Israel and Hamas.
Spot Brent crude oil ascend 0.89% to $89.66 per barrel. US West Texas Intermediate crude is up 0.02% to $85.25 a barrel.
The yellow metal gold is decline 0.06% to 1,933.15 dollars per ounce.
Market Wrap: Forex
The U.S. dollar swayed in a tight range on Tuesday as traders took stock of developments in the Middle East and braced for a slew of speeches by central bank officials this week headlined by Fed Chair Powell to gauge the monetary policy outlook.
Today, the U.S. dollar index measures the Greenback against a trade-weighted basket of six major currencies, which surged 0.17% to 106.210.
The Euro US Dollar (EUR/USD) is a widely traded pair that is down 0.14% today. This left the pair trading around $1.05450.
The Japanese yen was negative against the U.S. dollar on Tuesday. Today USD/JPY is slipped 0.04% to the 149.490 level.
Another commodity-related currency mixed against the U.S dollar, AUD/USD rose 0.14% to 0.63490, and NZD/USD slipped 0.69% to 0.58860 level.
EUR/USD Intraday: Trend on the downside
Our pivot point is at 1.05520
Preferable Price Action: Take sell positions below pivot level with targets at 1.05160 & 1.04970 in extension.
Alternative Price Action: Above pivot looks for a further upside to 1.05800 & 1.05990.
Comment: RSI is below 50 levels and Pairs below 20MA.
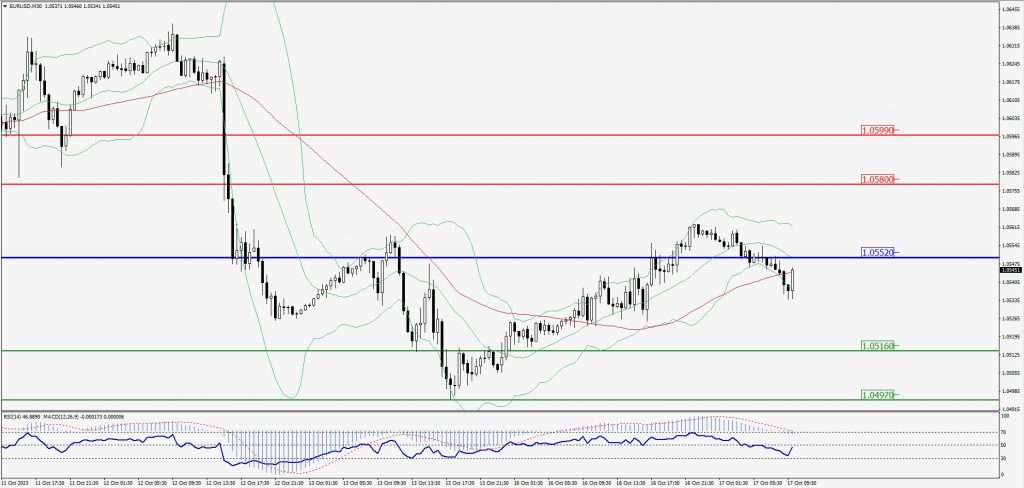
Green Lines Indicate Resistance Levels – Red Lines Indicate Support Levels
Light Blue is a Pivot Point – Black represents the price when the report was produced
GBP/USD Intraday: Major trend on the downside
Our pivot point is at 1.21940
Preferable Price Action: Sell positions below pivot with targets at 1.21320 & 1.20970 in extension.
Alternative Price Action: The price above pivot would call for further upside to 1.22500 & 1.22890.
Comment: RSI is above 50 levels and Pairs above its 20MA & 55MA.
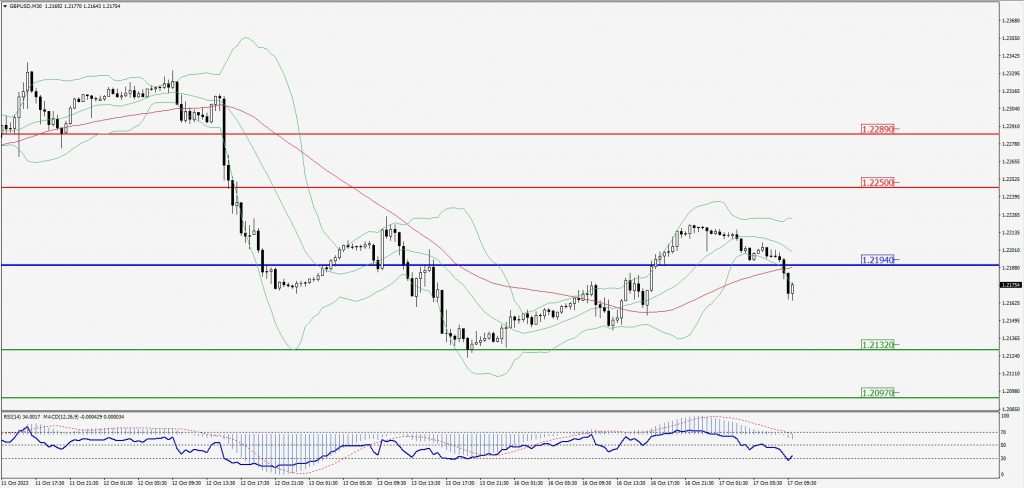
Green Lines Indicate Resistance Levels – Red Lines Indicate Support Levels
Light Blue is a Pivot Point – Black represents the price when the report was produced
USD/JPY Intraday: Major support level at 149.500
Our pivot point is at 149.500
Preferable Price Action: Buy position above pivot with the target at 149.840 and 150.100 in extension.
Alternative Price Action: The downside breakout of the pivot would call for 149.200 and 148.980.
Comment: MACD is above 50 level and Pairs above its 20MA & 55MA.
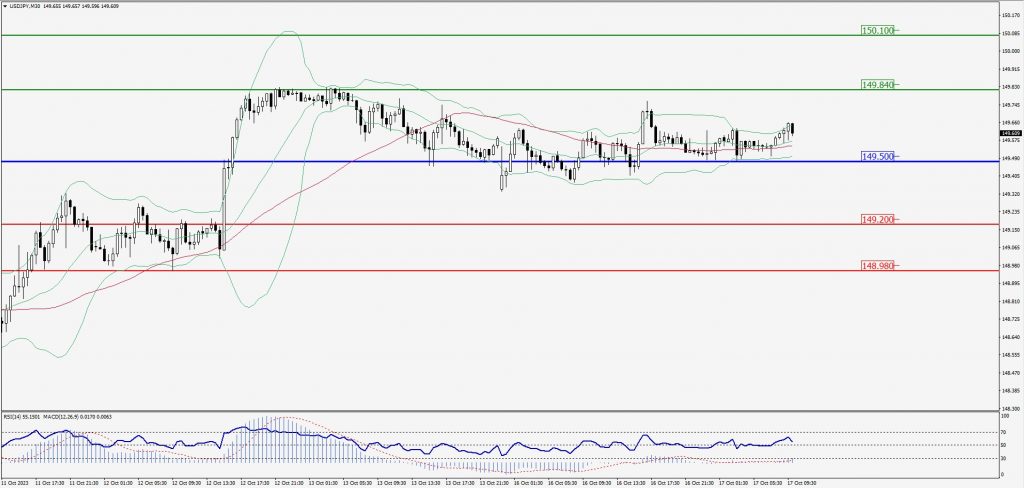
Green Lines Indicate Resistance Levels – Red Lines Indicate Support Levels
Light Blue is a Pivot Point – Black represents the price when the report was produced
AUD/USD Intraday: Trend on the upside
Our pivot point is at 0.63480
Preferable Price Action: Buy positions above pivot with targets at 0.63860 & 0.64110 in extension.
Alternative Price Action: Below pivot looks for a further downside with 0.63100 & 0.62820 as targets.
Comment: RSI is above 50 levels and Pairs above its 20MA & 55MA.
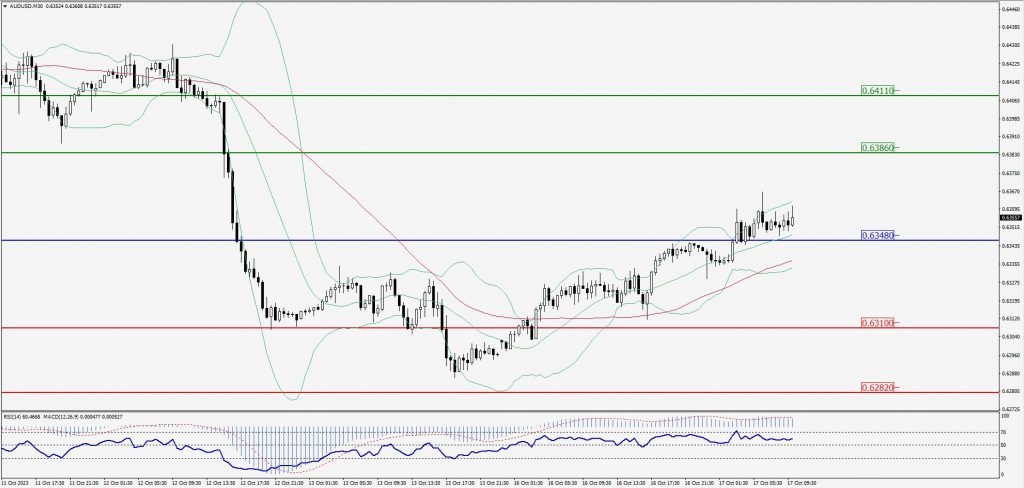
Green Lines Indicate Resistance Levels – Red Lines Indicate Support Levels
Light Blue is a Pivot Point – Black represents the price when the report was produced
CRUDEOIL Intraday: Trend on the downside
Our pivot point is at 85.63
Preferable Price Action: Below pivot sell oil with 84.55 & 83.88 as targets.
Alternative Price Action: Buy crude above pivot with targets at 86.68 and 87.47 in extension.
Comment: MACD is negative territory and Pairs below 55MA.
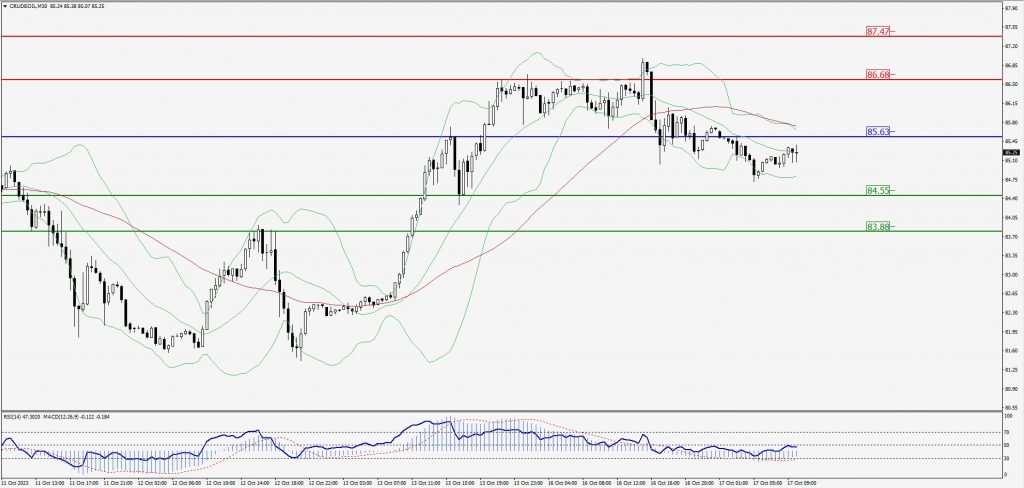
Green Lines Indicate Resistance Levels – Red Lines Indicate Support Levels
Light Blue is a Pivot Point – Black represents the price when the report was produced
XAU/USD Intraday: Trend on the upside
Our pivot point is 1915.50
Preferable Price Action: Further upside to 1930.70 and 1940.50.
Alternative Price Action: If the price gives a downside breakout of a pivot, then the price extends to 1902.60 and 1893.50.
Comment: MACD is above 50 level and Pairs above 20MA.
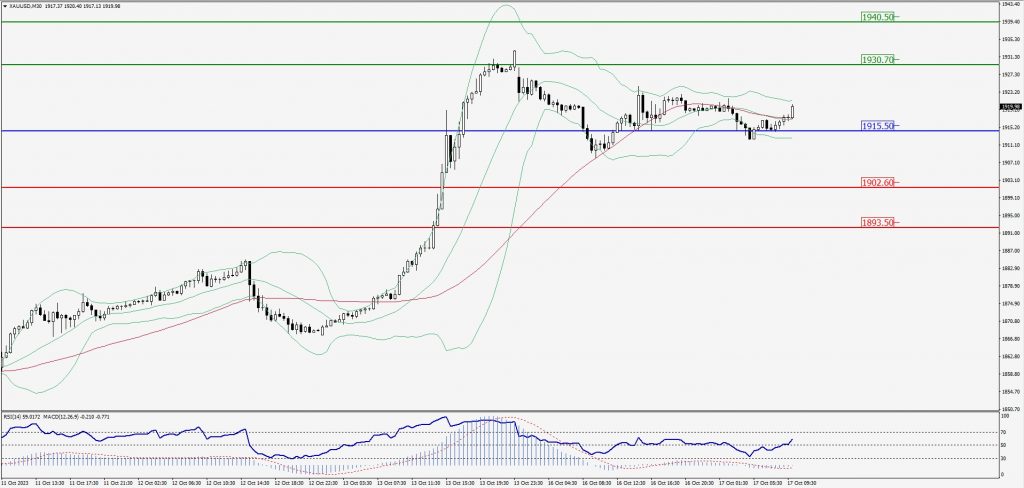
Green Lines Indicate Resistance Levels – Red Lines Indicate Support Levels
Light Blue is a Pivot Point – Black represents the price when the report was produced
Dow Jones Intraday: In a consolidation zone
Our pivot point is 33,933.00
Preferable Price Action: Take buy positions above the pivot with targets at 34,054.00 & 34,133.00.
Alternative Price Action: Below 33,933.00 looks for further downside to 33,839.00 & 33,764.00.
Comment: RSI is above 50 levels and Pairs above 55MA.
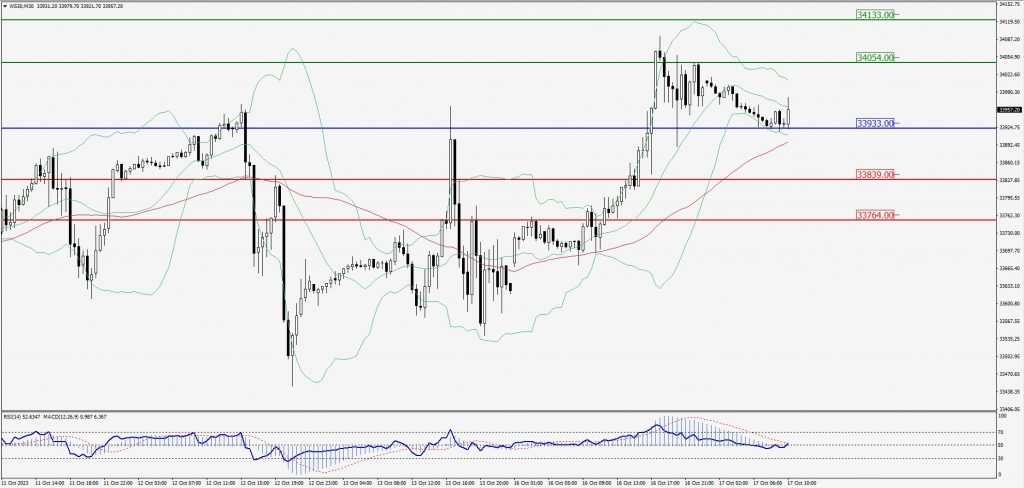
Green Lines Indicate Resistance Levels – Red Lines Indicate Support Levels
Light Blue is a Pivot Point – Black represents the price when the report was produced