Market Wrap: Stocks, Bonds, Commodities
Stock futures were little changed in overnight trading as Wall Street looked ahead to Wednesday’s producer price index.
The Dow Jones Industrial Average rose 134.65 points to 33,739.30, the S&P 500 gain 0.52% to 4,358.24 and the Nasdaq Composite add 78.61 points to 13,562.84.
MSCI’s index of Asia-Pacific stocks outside Japan is advance 1.33% to 609.68 levels. The Australian index was higher by 0.68% to 7,088.40. Japanese Nikkei Index ascend 0.55% today.
European stocks were positive on Wednesday, with the Stoxx Europe 50 Index fell 0.34% to 4,190.95, Germany’s DAX drop 0.06% to 15,415.65, and France’s CAC decline 0.59% to 7,120.75 and U.K.’s FTSE 100 subtract 1.81% to 7,637.20.
Benchmark 10-year U.S. Treasury fell as demand for safe assets ascend again, today 10-year bond yields negative 1.79% to 4.5700.
Oil prices oil fell more than $1 a barrel on Tuesday, continuing a slide that began earlier in the day with traders focused on demand levels but still cautious as they watched for potential supply disruptions amid military clashes between Israel and the Palestinian Islamist group Hamas.
Spot Brent crude oil drop 0.34% to $87.42 per barrel. US West Texas Intermediate crude is down 0.31% to $85.70 a barrel.
The yellow metal gold is advance 0.42% to 1,883.05 dollars per ounce.
Market Wrap: Forex
The dollar was broadly flat against major currencies, as traders trained their sights on the release of Federal Reserve minutes later on Wednesday and a key inflation print the next day for hints on the future path for interest rates.
Today, the U.S. dollar index measures the Greenback against a trade-weighted basket of six major currencies, which slipped 0.04% to 105.510.
The Euro US Dollar (EUR/USD) is a widely traded pair that is up 0.06% today. This left the pair trading around $1.06090.
The Japanese yen was negative against the U.S. dollar on Wednesday. Today USD/JPY is surged 0.01% to the 148.700 level.
Another commodity-related currency negative against the U.S dollar, AUD/USD fell 0.19% to 0.64190, and NZD/USD slipped 0.40% to 0.60200 level.
EUR/USD Intraday: Support level at 1.05990
Our pivot point is at 1.05990
Preferable Price Action: Take buy positions above pivot level with targets at 1.06330 & 1.06530 in extension.
Alternative Price Action: Below pivot looks for a further downside to 1.05660 & 1.05460.
Comment: RSI is above 50 levels and Pairs above 55MA.
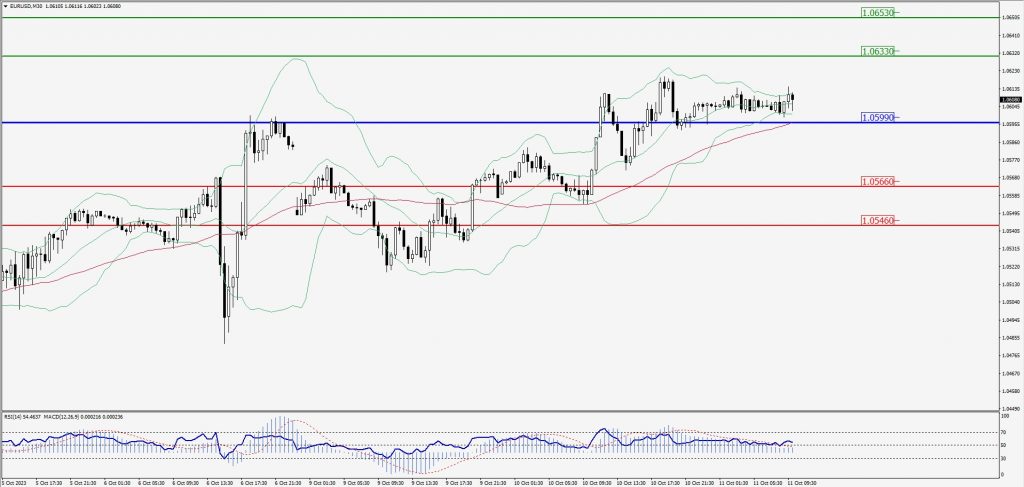
Green Lines Indicate Resistance Levels – Red Lines Indicate Support Levels
Light Blue is a Pivot Point – Black represents the price when the report was produced
GBP/USD Intraday: In a consolidation zone
Our pivot point is at 1.23020
Preferable Price Action: Sell positions below pivot with targets at 1.22590 & 1.22330 in extension.
Alternative Price Action: The price above pivot would call for further upside to 1.23360 & 1.23600.
Comment: RSI is at 50 levels and Pairs below 20MA.
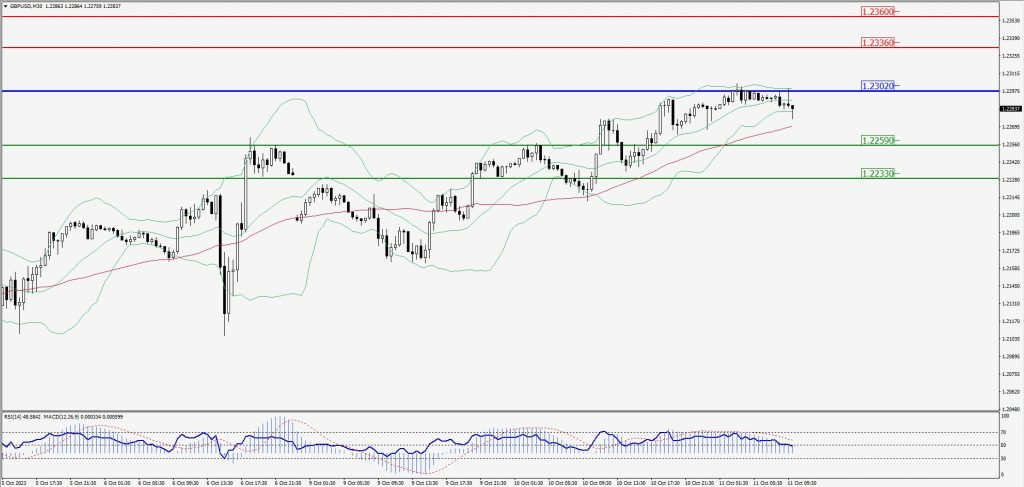
Green Lines Indicate Resistance Levels – Red Lines Indicate Support Levels
Light Blue is a Pivot Point – Black represents the price when the report was produced
USD/JPY Intraday: Trend on the upside
Our pivot point is at 148.800
Preferable Price Action: Buy position above pivot with the target at 149.190 and 149.460 in extension.
Alternative Price Action: The downside breakout of the pivot would call for 148.440 and 148.200.
Comment: MACD is above 50 level and Pairs above its 20MA & 55MA.
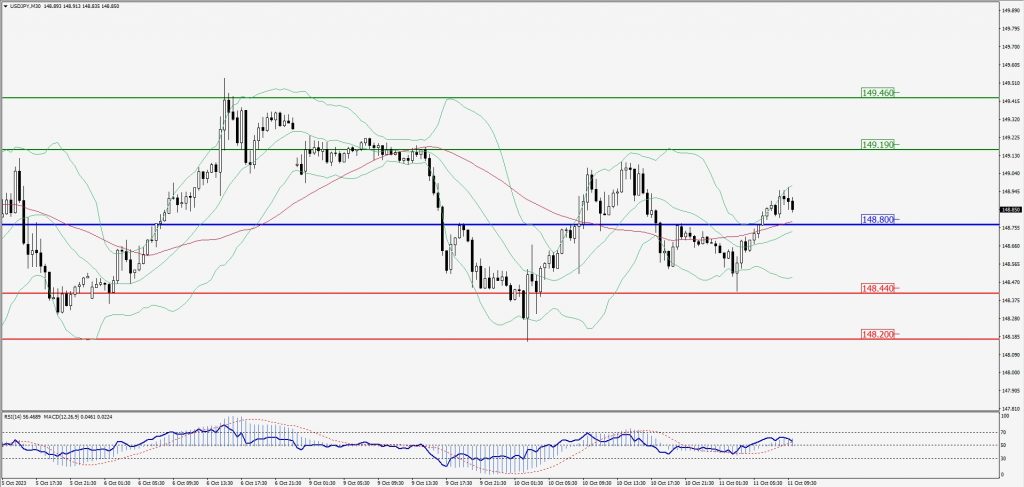
Green Lines Indicate Resistance Levels – Red Lines Indicate Support Levels
Light Blue is a Pivot Point – Black represents the price when the report was produced
AUD/USD Intraday: Support level at 0.64170
Our pivot point is at 0.64170
Preferable Price Action: Buy positions above pivot with targets at 0.64530 & 0.64720 in extension.
Alternative Price Action: Below pivot looks for a further downside with 0.63930 & 0.63750 as targets.
Comment: RSI is above 50 levels and Pairs above 55MA.
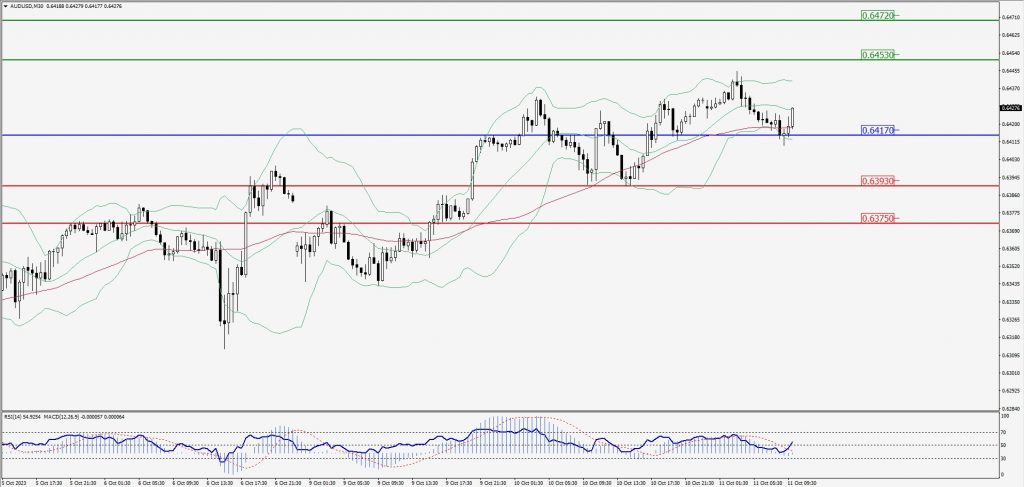
Green Lines Indicate Resistance Levels – Red Lines Indicate Support Levels
Light Blue is a Pivot Point – Black represents the price when the report was produced
CRUDEOIL Intraday: Major support level at 84.66
Our pivot point is at 84.66
Preferable Price Action: Above pivot buy oil with 85.82 & 86.52 as targets.
Alternative Price Action: Sell crude below pivot with targets at 83.73 and 83.07 in extension.
Comment: MACD is positive territory and Pairs above its 20MA & 55MA.
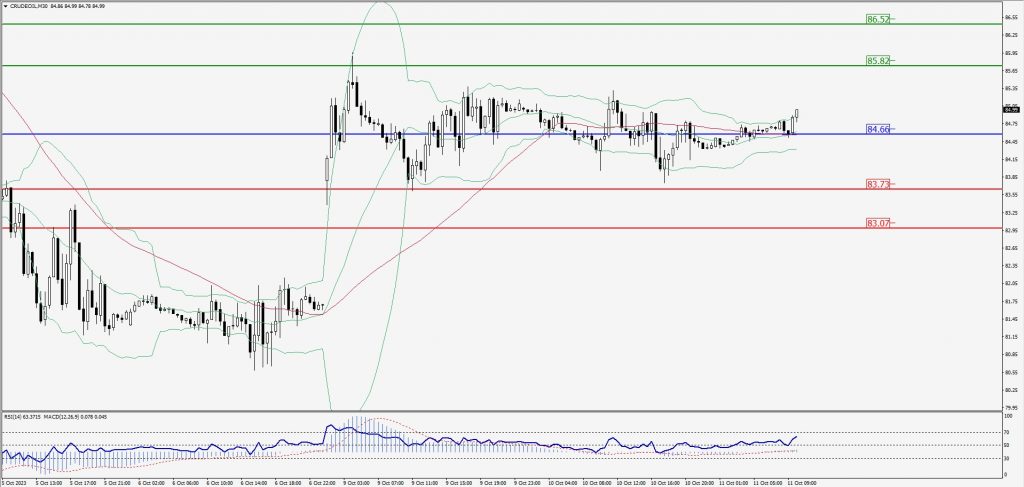
Green Lines Indicate Resistance Levels – Red Lines Indicate Support Levels
Light Blue is a Pivot Point – Black represents the price when the report was produced
XAU/USD Intraday: Trend on the upside
Our pivot point is 1860.30
Preferable Price Action: Further upside to 1872.40 and 1878.90.
Alternative Price Action: If the price gives a downside breakout of a pivot, then the price extends to 1850.80 and 1843.90.
Comment: MACD is above 50 level and Pairs above its 20MA & 55MA.
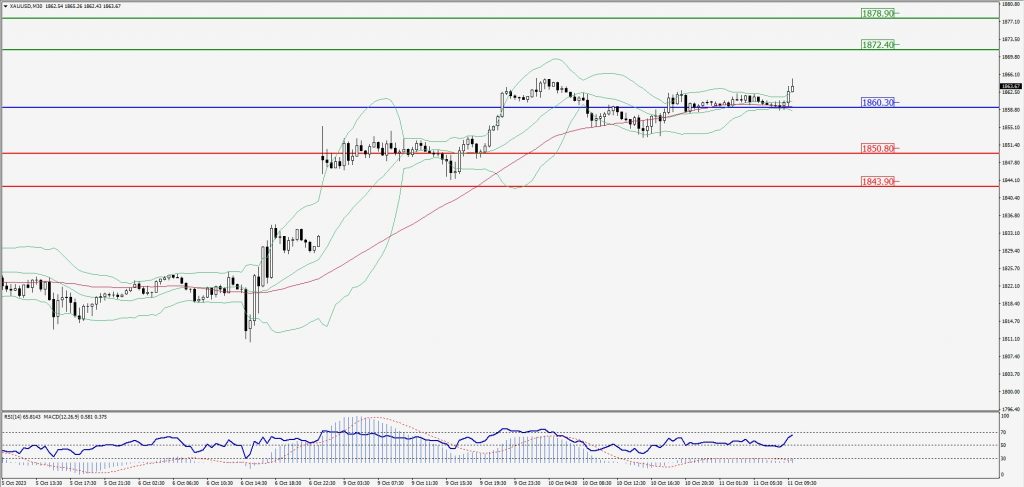
Green Lines Indicate Resistance Levels – Red Lines Indicate Support Levels
Light Blue is a Pivot Point – Black represents the price when the report was produced
Dow Jones Intraday: Trend on the upside
Our pivot point is 33,710.00
Preferable Price Action: Take buy positions above the pivot with targets at 33,983.00 & 34,153.00.
Alternative Price Action: Below 33,710.00 looks for further downside to 33,491.00 & 33,313.00.
Comment: RSI is above 50 levels and Pairs above 55MA.
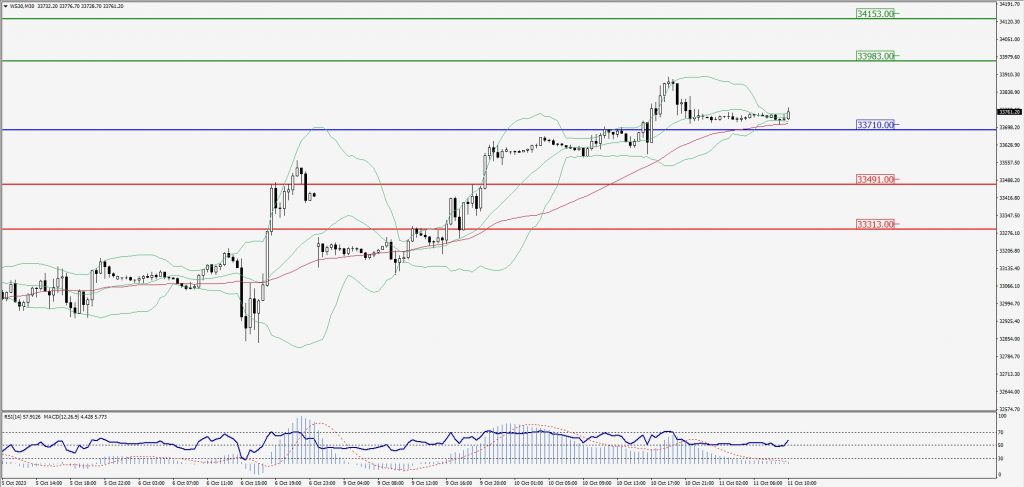
Green Lines Indicate Resistance Levels – Red Lines Indicate Support Levels
Light Blue is a Pivot Point – Black represents the price when the report was produced