Market Wrap: Stocks, Bonds, Commodities
US stock futures were near the flat line on Monday night as Wall Street assessed the impact and risks of a protracted conflict from the Israel-Hamas war.
The Dow Jones Industrial Average rose 197.07 points to 33,604.65, the S&P 500 gain 0.63% to 4,335.66 and the Nasdaq Composite add 52.90 points to 13,484.24.
MSCI’s index of Asia-Pacific stocks outside Japan is advance 0.49% to 600.93 levels. The Australian index was higher by 1.01% to 7,040.60. Japanese Nikkei Index ascend 2.48% today.
European stocks were positive on Tuesday, with the Stoxx Europe 50 Index rose 1.57% to 4,176.95, Germany’s DAX ascend 1.61% to 15,373.31, and France’s CAC advance 1.40% to 7,120.23 and U.K.’s FTSE 100 add 1.55% to 7,608.41.
Benchmark 10-year U.S. Treasury fell as demand for safe assets ascend again, today 10-year bond yields positive 0.34% to 4.6580.
Oil prices jumped about 4 percent on Monday as the Israel-Hamas conflict extended into its third day following a surprise attack on Israel by Palestinian militants Hamas.
Spot Brent crude oil ascend 0.17% to $88.30 per barrel. US West Texas Intermediate crude is up 0.21% to $86.54 a barrel.
The yellow metal gold is advance 0.45% to 1,872.85 dollars per ounce.
Market Wrap: Forex
The U.S. dollar edged higher Tuesday, supported by its safe-haven status as violence in the Middle East continued, but gains were limited after dovish comments from a couple of Fed officials.
Today, the U.S. dollar index measures the Greenback against a trade-weighted basket of six major currencies, which slipped 0.23% to 105.560.
The Euro US Dollar (EUR/USD) is a widely traded pair that is up 0.37% today. This left the pair trading around $1.06040.
The Japanese yen was negative against the U.S. dollar on Tuesday. Today USD/JPY is surged 0.17% to the 148.750 level.
Another commodity-related currency positive against the U.S dollar, AUD/USD rose 0.22% to 0.64240, and NZD/USD surged 0.04% to 0.60220 level.
EUR/USD Intraday: Trend on the downside
Our pivot point is at 1.05700
Preferable Price Action: Take sell positions below pivot level with targets at 1.05420 & 1.05230 in extension.
Alternative Price Action: Above pivot looks for a further upside to 1.05940 & 1.06140.
Comment: RSI is below 50 levels and Pairs below 20MA.
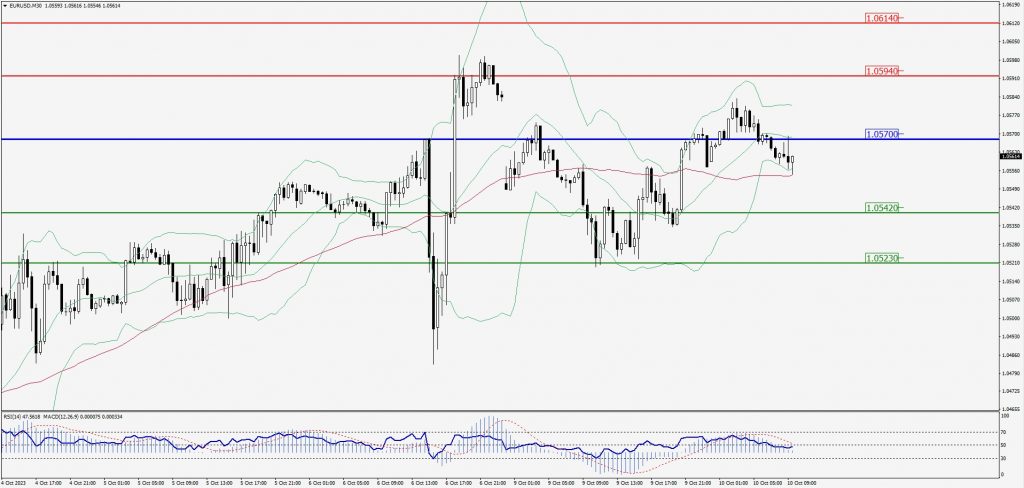
Green Lines Indicate Resistance Levels – Red Lines Indicate Support Levels
Light Blue is a Pivot Point – Black represents the price when the report was produced
GBP/USD Intraday: Resistance level at 1.22450
Our pivot point is at 1.22450
Preferable Price Action: Sell positions below pivot with targets at 1.22100 & 1.21890 in extension.
Alternative Price Action: The price above pivot would call for further upside to 1.22770 & 1.22970.
Comment: RSI is below 50 levels and Pairs below 20MA.
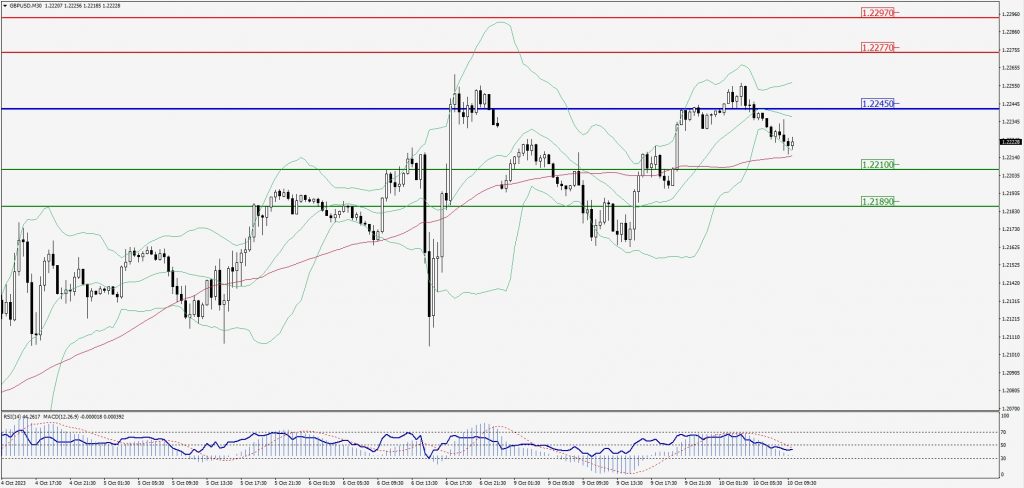
Green Lines Indicate Resistance Levels – Red Lines Indicate Support Levels
Light Blue is a Pivot Point – Black represents the price when the report was produced
USD/JPY Intraday: Trend on the upside
Our pivot point is at 148.800
Preferable Price Action: Buy position above pivot with the target at 149.190 and 149.460 in extension.
Alternative Price Action: The downside breakout of the pivot would call for 148.440 and 148.200.
Comment: MACD is above 50 level and Pairs above its 20MA & 55MA.
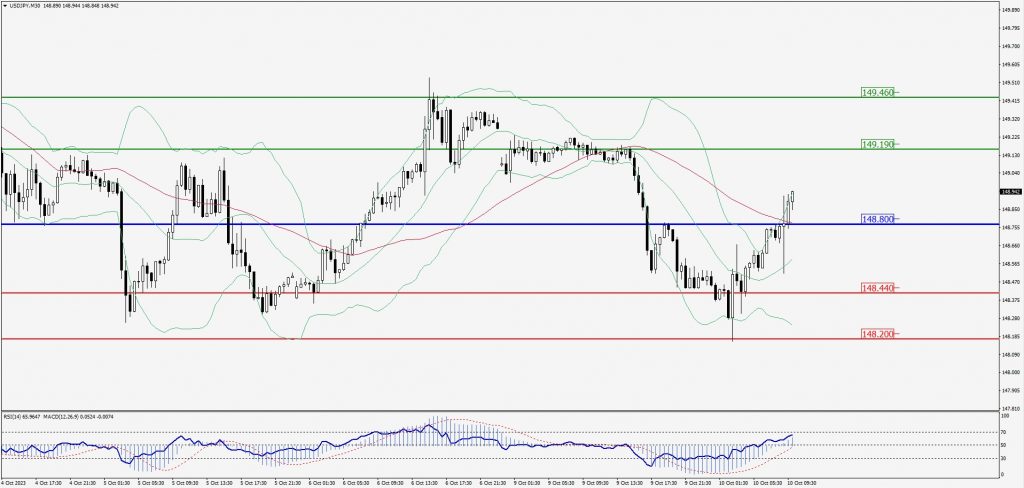
Green Lines Indicate Resistance Levels – Red Lines Indicate Support Levels
Light Blue is a Pivot Point – Black represents the price when the report was produced
AUD/USD Intraday: Trend on the downside
Our pivot point is at 0.64110
Preferable Price Action: Sell positions below pivot with targets at 0.63800 & 0.63620 in extension.
Alternative Price Action: Above pivot looks for a further upside with 0.64400 & 0.64580 as targets.
Comment: RSI is below 50 levels and Pairs below 20MA.
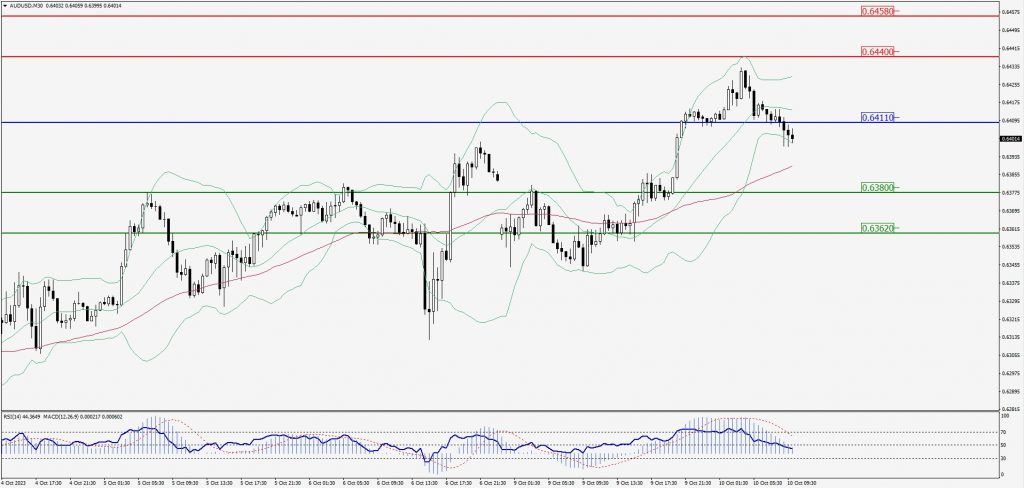
Green Lines Indicate Resistance Levels – Red Lines Indicate Support Levels
Light Blue is a Pivot Point – Black represents the price when the report was produced
CRUDEOIL Intraday: Trend on the downside
Our pivot point is at 84.72
Preferable Price Action: Below pivot sell oil with 83.41 & 82.36 as targets.
Alternative Price Action: Buy crude above pivot with targets at 86.19 and 87.25 in extension.
Comment: MACD is negative territory and Pairs below its 20MA & 55MA.
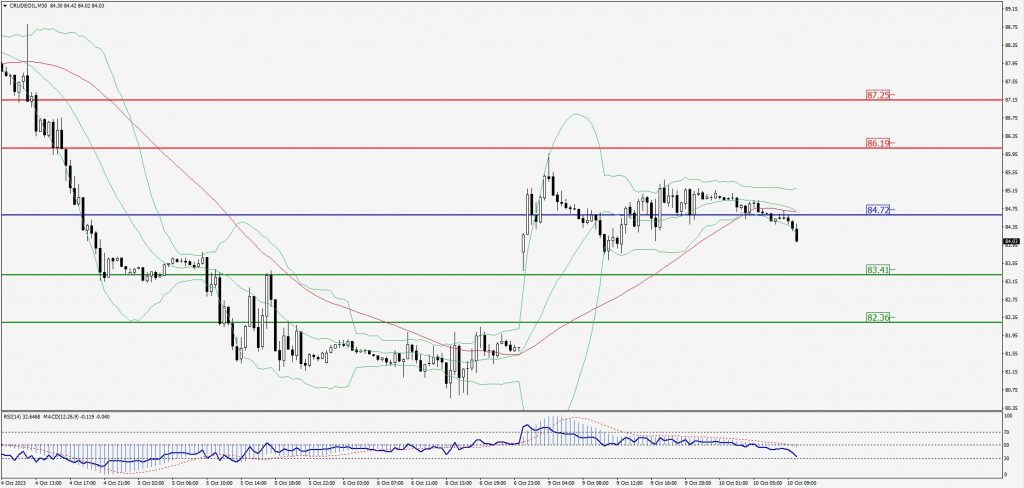
Green Lines Indicate Resistance Levels – Red Lines Indicate Support Levels
Light Blue is a Pivot Point – Black represents the price when the report was produced
XAU/USD Intraday: Trend on the downside
Our pivot point is 1862.00
Preferable Price Action: Further downside to 1850.00 and 1841.20.
Alternative Price Action: If the price gives an upside breakout of a pivot, then the price extends to 1872.80 and 1881.30.
Comment: MACD is below 50 level and Pairs below 20MA.
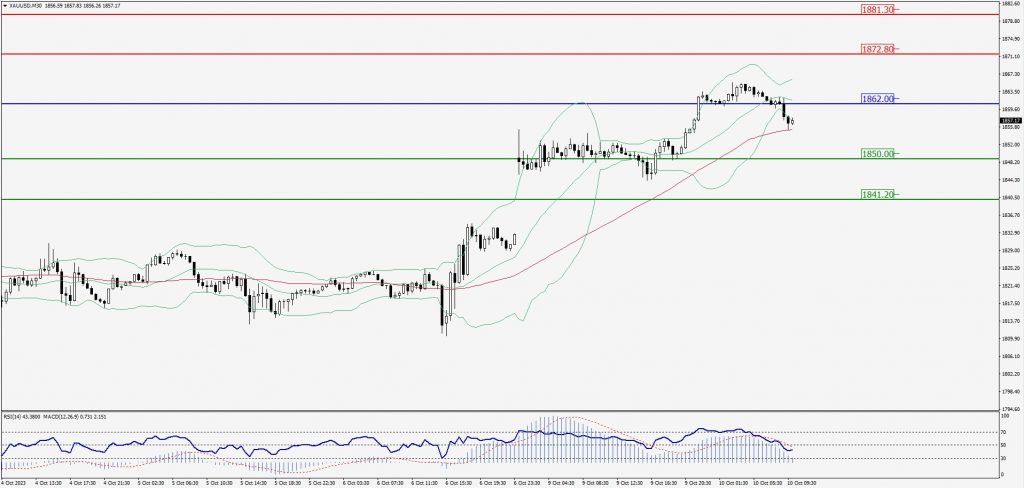
Green Lines Indicate Resistance Levels – Red Lines Indicate Support Levels
Light Blue is a Pivot Point – Black represents the price when the report was produced
Dow Jones Intraday: Trend on the upside
Our pivot point is 33,585.00
Preferable Price Action: Take buy positions above the pivot with targets at 33,791.00 & 33,939.00.
Alternative Price Action: Below 33,585.00 looks for further downside to 33,389.00 & 33,254.00.
Comment: RSI is above 50 levels and Pairs above 55MA.
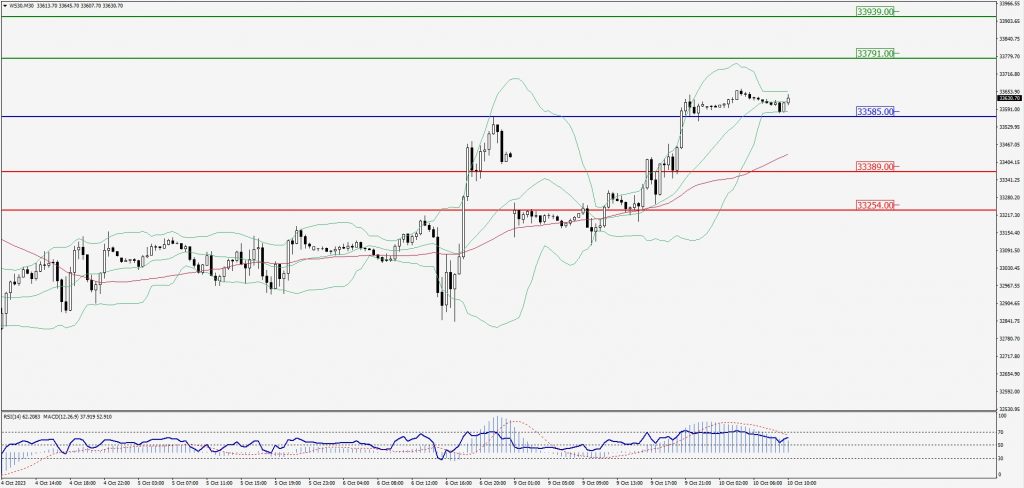
Green Lines Indicate Resistance Levels – Red Lines Indicate Support Levels
Light Blue is a Pivot Point – Black represents the price when the report was produced