Market Wrap: Stocks, Bonds, Commodities
Stock futures were lower on Sunday as the attack on Israel by Palestinian militants adds geopolitical risk to an already fragile market dealing with inflation and surging interest rates.
The Dow Jones Industrial Average rose 288.01 points to 33,407.58, the S&P 500 gain 1.18% to 4,308.50 and the Nasdaq Composite add 211.51 points to 13,431.34.
MSCI’s index of Asia-Pacific stocks outside Japan is decline 0.12% to 598.20 levels. The Australian index was higher by 0.23% to 6,970.20. Japanese Nikkei Index drop 0.26% today.
European stocks were negative on Monday, with the Stoxx Europe 50 Index fell 0.40% to 4,128.05, Germany’s DAX drop 0.34% to 15,177.65, and France’s CAC decline 0.27% to 7,040.29 and U.K.’s FTSE 100 add 0.47% to 7,529.80.
Benchmark 10-year U.S. Treasury fell as demand for safe assets ascend again, today 10-year bond yields negative 1.02% to 4.7340.
Oil prices rose on Friday but remained posted their steepest weekly losses since March, after another partial lifting of Russia’s fuel export ban compounded demand fears due to macroeconomic headwinds.
Spot Brent crude oil ascend 2.74% to $86.93 per barrel. US West Texas Intermediate crude is up 3.04% to $85.34 a barrel.
The yellow metal gold is advance 1.04% to 1,864.35 dollars per ounce.
Market Wrap: Forex
The safe-haven U.S. dollar gained in early European trade Monday as the escalation of the conflict in the Middle East hit risk sentiment, following on from last week’s strong payrolls report.
Today, the U.S. dollar index measures the Greenback against a trade-weighted basket of six major currencies, which surged 0.37% to 106.170.
The Euro US Dollar (EUR/USD) is a widely traded pair that is down 0.43% today. This left the pair trading around $1.05430.
The Japanese yen was negative against the U.S. dollar on Monday. Today USD/JPY is slipped 0.12% to the 149.140 level.
Another commodity-related currency negative against the U.S dollar, AUD/USD fell 0.36% to 0.63600, and NZD/USD slipped 0.22% to 0.59740 level.
EUR/USD Intraday: Trend on the downside
Our pivot point is at 1.05490
Preferable Price Action: Take sell positions below pivot level with targets at 1.05120 & 1.04880 in extension.
Alternative Price Action: Above pivot looks for a further upside to 1.05850 & 1.06110.
Comment: RSI is below 50 levels and Pairs below its 20MA & 55MA.
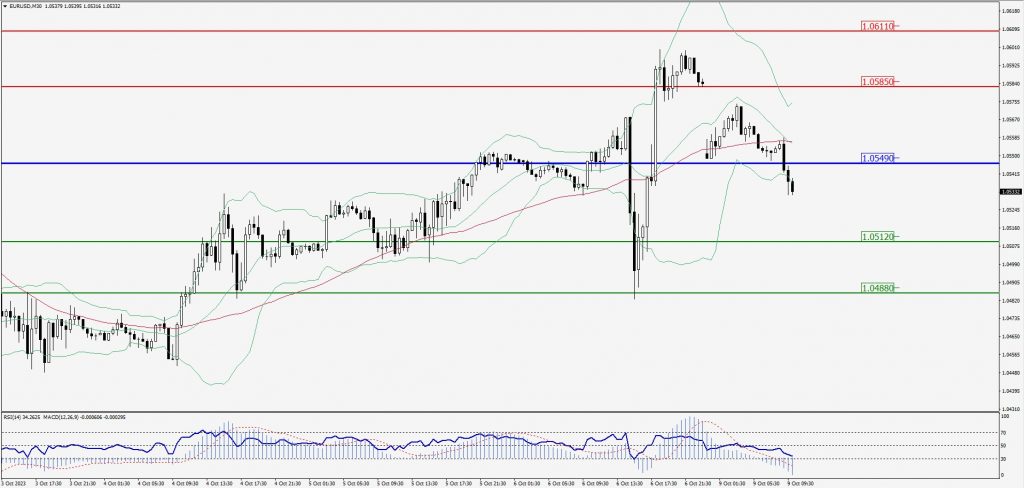
Green Lines Indicate Resistance Levels – Red Lines Indicate Support Levels
Light Blue is a Pivot Point – Black represents the price when the report was produced
GBP/USD Intraday: Resistance level at 1.22090
Our pivot point is at 1.22090
Preferable Price Action: Sell positions below pivot with targets at 1.21480 & 1.21090 in extension.
Alternative Price Action: The price above pivot would call for further upside to 1.22630 & 1.23030.
Comment: RSI is below 50 levels and Pairs below its 20MA & 55MA.
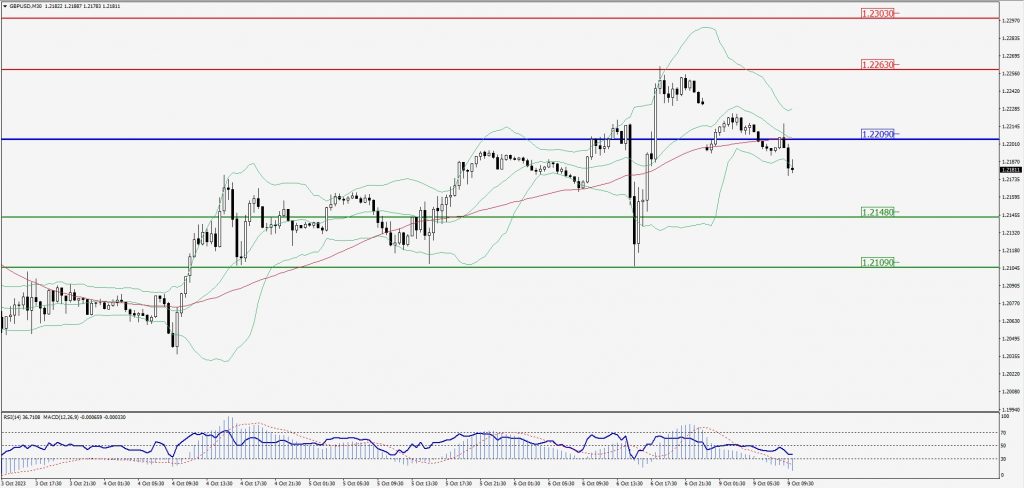
Green Lines Indicate Resistance Levels – Red Lines Indicate Support Levels
Light Blue is a Pivot Point – Black represents the price when the report was produced
USD/JPY Intraday: In a consolidation zone
Our pivot point is at 149.400
Preferable Price Action: Sell position below pivot with the target at 148.680 and 148.270 in extension.
Alternative Price Action: The upside breakout of the pivot would call for 150.020 and 150.400.
Comment: MACD is at 50 level.
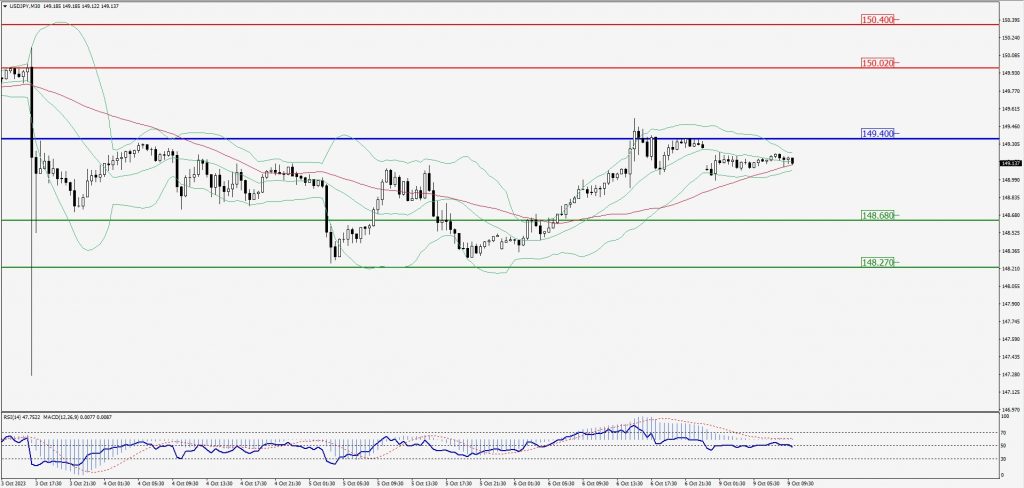
Green Lines Indicate Resistance Levels – Red Lines Indicate Support Levels
Light Blue is a Pivot Point – Black represents the price when the report was produced
AUD/USD Intraday: Trend on the downside
Our pivot point is at 0.63620
Preferable Price Action: Sell positions below pivot with targets at 0.63270 & 0.63050 in extension.
Alternative Price Action: Above pivot looks for a further upside with 0.63930 & 0.64190 as targets.
Comment: RSI is below 50 levels and Pairs below its 20MA & 55MA.
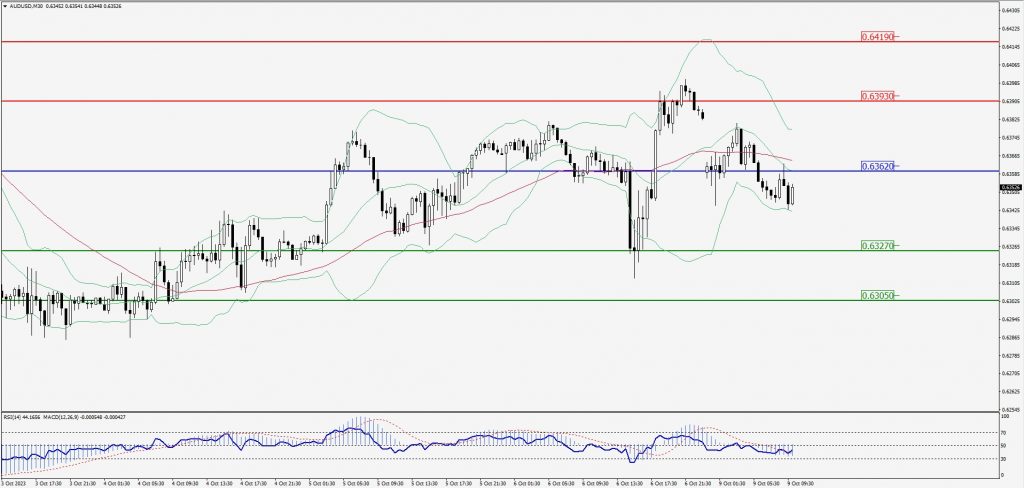
Green Lines Indicate Resistance Levels – Red Lines Indicate Support Levels
Light Blue is a Pivot Point – Black represents the price when the report was produced
CRUDEOIL Intraday: Trend on the upside
Our pivot point is at 83.42
Preferable Price Action: Above pivot buy oil with 85.54 & 86.71 as targets.
Alternative Price Action: Sell crude below pivot with targets at 81.60 and 80.64 in extension.
Comment: MACD is positive territory and Pairs above 55MA.
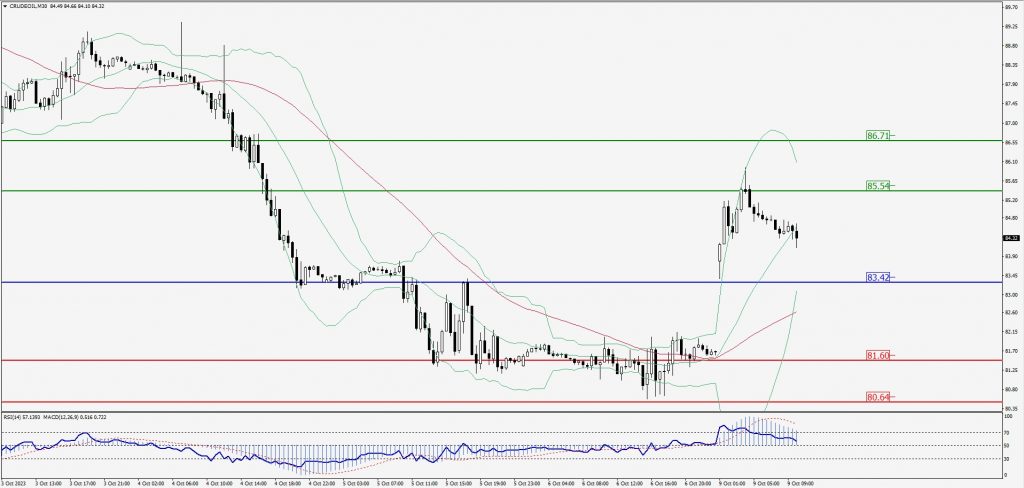
Green Lines Indicate Resistance Levels – Red Lines Indicate Support Levels
Light Blue is a Pivot Point – Black represents the price when the report was produced
XAU/USD Intraday: Support level at 1847.30
Our pivot point is 1847.30
Preferable Price Action: Further upside to 1860.10 and 1868.50.
Alternative Price Action: If the price gives a downside breakout of a pivot, then the price extends to 1835.10 and 1827.20.
Comment: MACD is above 50 level and Pairs above its 20MA & 55MA.
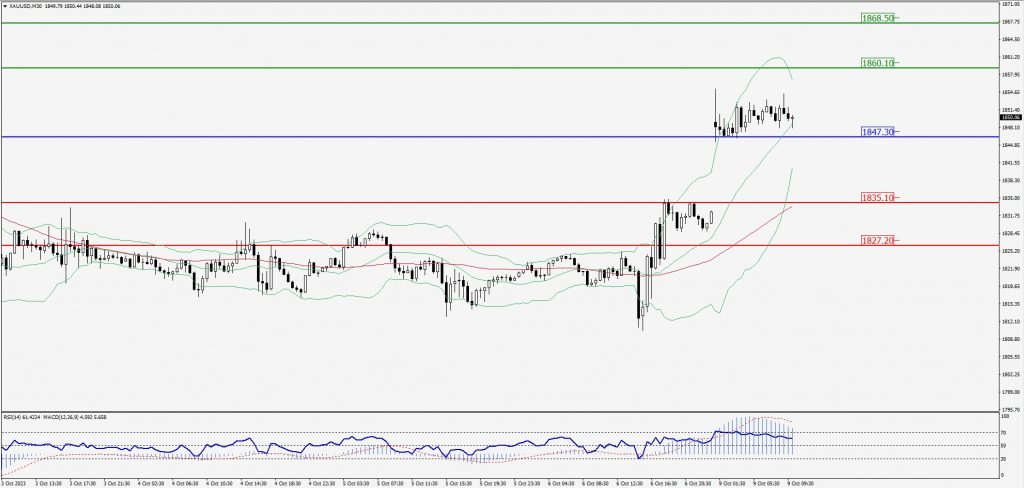
Green Lines Indicate Resistance Levels – Red Lines Indicate Support Levels
Light Blue is a Pivot Point – Black represents the price when the report was produced
Dow Jones Intraday: Trend on the downside
Our pivot point is 33,193.00
Preferable Price Action: Take sell positions below the pivot with targets at 32,942.00 & 32,786.00.
Alternative Price Action: Above 33,193.00 looks for further upside to 33,419.00 & 33,582.00.
Comment: RSI is below 50 levels and Pairs below 20MA.
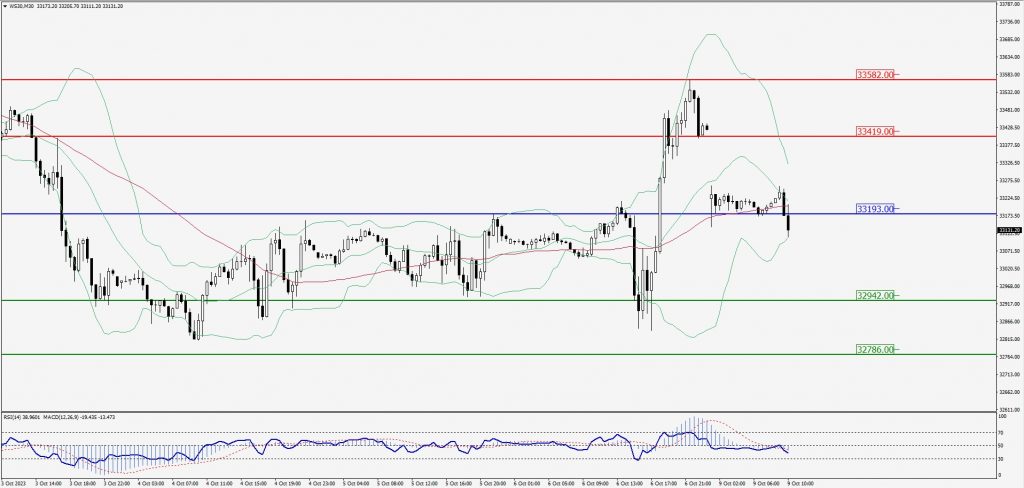
Green Lines Indicate Resistance Levels – Red Lines Indicate Support Levels
Light Blue is a Pivot Point – Black represents the price when the report was produced