Market Wrap: Stocks, Bonds, Commodities
Stocks ticked lower Thursday as investors looked toward key jobs data on Friday that could determine the next move for interest rates.
The Dow Jones Industrial Average fell 9.98 points to 33,119.57, the S&P 500 fell 0.13% to 4,258.19 and the Nasdaq Composite subtract 16.18 points to 13,219.83.
MSCI’s index of Asia-Pacific stocks outside Japan is advance 0.78% to 598.15 levels. The Australian index was higher by 0.41% to 6,954.20. Japanese Nikkei Index drop 0.07% today.
European stocks were positive on Friday, with the Stoxx Europe 50 Index rose 0.45% to 4,118.15, Germany’s DAX ascend 0.42% to 15,133.15, and France’s CAC advance 0.27% to 7,017.19 and U.K.’s FTSE 100 add 0.25% to 7,469.62.
Benchmark 10-year U.S. Treasury fell as demand for safe assets ascend again, today 10-year bond yields positive 0.57% to 4.7410.
Oil prices dipped on Thursday as an uncertain demand outlook overshadowed an OPEC+ decision to maintain oil output cuts, keeping supply tight.
Spot Brent crude oil ascend 0.14% to $84.17 per barrel. US West Texas Intermediate crude is up 0.16% to $82.44 a barrel.
The yellow metal gold is advance 0.20% to 1,835.45 dollars per ounce.
Market Wrap: Forex
The U.S. dollar traded higher Friday, on course for another positive week, ahead of the release of the monthly U.S. nonfarm payrolls which could influence Federal Reserve thinking.
Today, the U.S. dollar index measures the Greenback against a trade-weighted basket of six major currencies, which surged 0.07% to 106.130.
The Euro US Dollar (EUR/USD) is a widely traded pair that is up 0.01% today. This left the pair trading around $1.05490.
The Japanese yen was negative against the U.S. dollar on Friday. Today USD/JPY is surged 0.29% to the 148.910 level.
Another commodity-related currency negative against the U.S dollar, AUD/USD fell 0.09% to 0.63640, and NZD/USD slipped 0.02% to 0.59620 level.
EUR/USD Intraday: In a consolidation zone
Our pivot point is at 1.05510
Preferable Price Action: Take sell positions below pivot level with targets at 1.05120 & 1.04880 in extension.
Alternative Price Action: Above pivot looks for a further upside to 1.05850 & 1.06120.
Comment: RSI is at 50 levels and Pairs below 20MA.
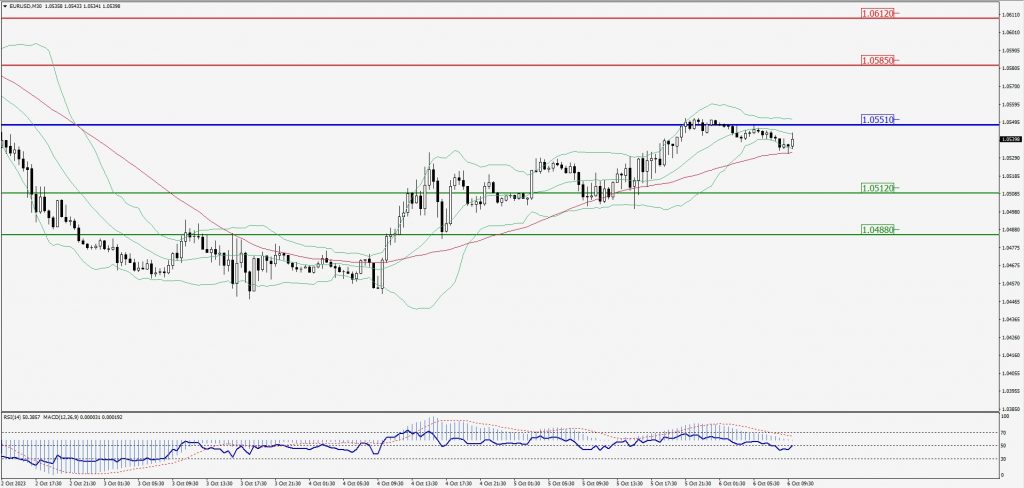
Green Lines Indicate Resistance Levels – Red Lines Indicate Support Levels
Light Blue is a Pivot Point – Black represents the price when the report was produced
GBP/USD Intraday: Support level at 1.21700
Our pivot point is at 1.21700
Preferable Price Action: Buy positions above pivot with targets at 1.22210 & 1.22490 in extension.
Alternative Price Action: The price below pivot would call for further downside to 1.21250 & 1.20930.
Comment: RSI is above 50 levels and Pairs above 55MA.
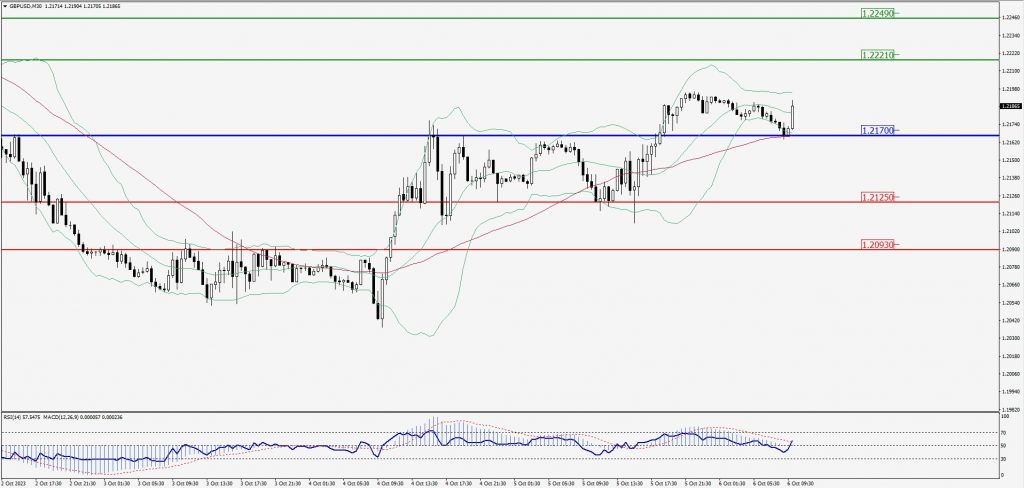
Green Lines Indicate Resistance Levels – Red Lines Indicate Support Levels
Light Blue is a Pivot Point – Black represents the price when the report was produced
USD/JPY Intraday: Trend on the upside
Our pivot point is at 148.760
Preferable Price Action: Buy position above pivot with the target at 149.350 and 149.780 in extension.
Alternative Price Action: The downside breakout of the pivot would call for 148.220 and 147.820.
Comment: MACD is above 50 level and Pairs above its 20MA & 55MA.
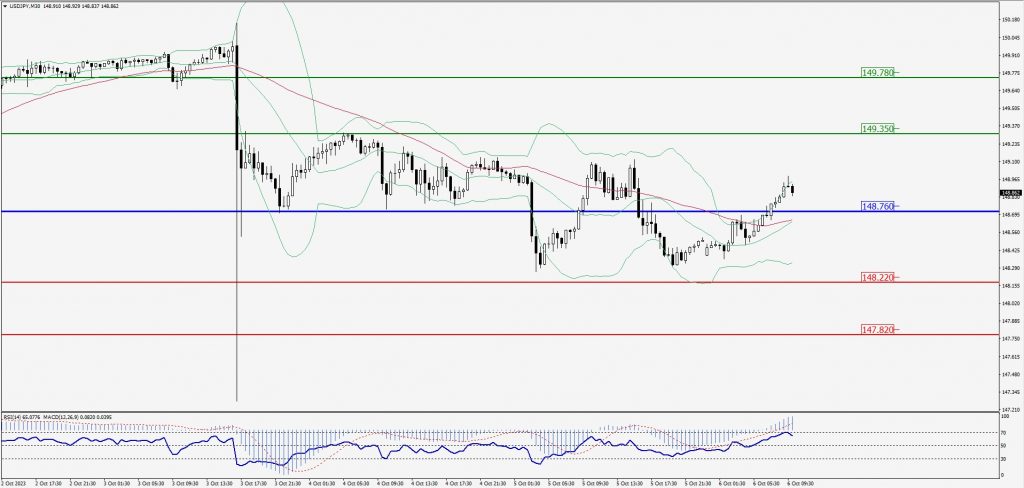
Green Lines Indicate Resistance Levels – Red Lines Indicate Support Levels
Light Blue is a Pivot Point – Black represents the price when the report was produced
AUD/USD Intraday: Trend on the downside
Our pivot point is at 0.63750
Preferable Price Action: Sell positions below pivot with targets at 0.63440 & 0.63240 in extension.
Alternative Price Action: Above pivot looks for a further upside with 0.64040 & 0.64250 as targets.
Comment: RSI is below 50 levels and Pairs below 20MA.
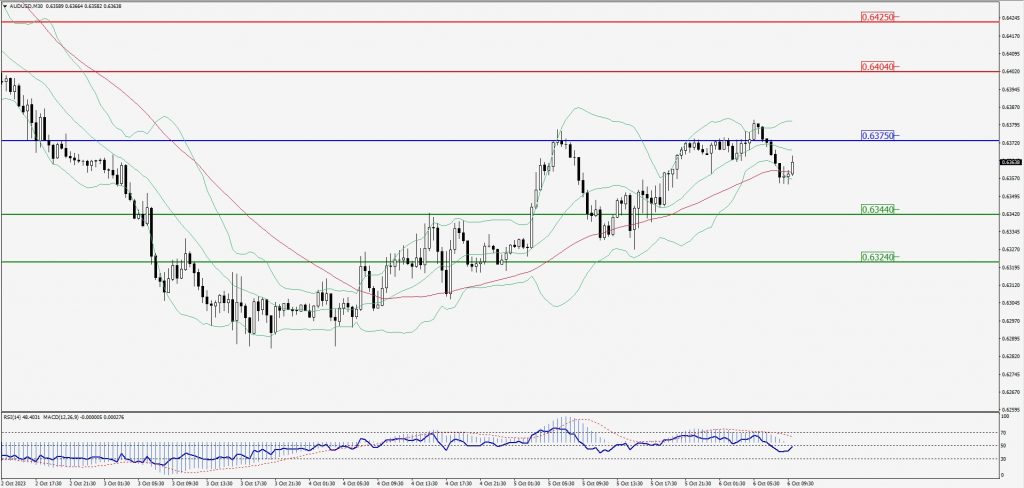
Green Lines Indicate Resistance Levels – Red Lines Indicate Support Levels
Light Blue is a Pivot Point – Black represents the price when the report was produced
CRUDEOIL Intraday: Trend on the downside
Our pivot point is at 82.31
Preferable Price Action: Below pivot sell oil with 78.56 & 76.43 as targets.
Alternative Price Action: Buy crude above pivot with targets at 85.54 and 88.03 in extension.
Comment: MACD is negative territory and Pairs below 55MA.
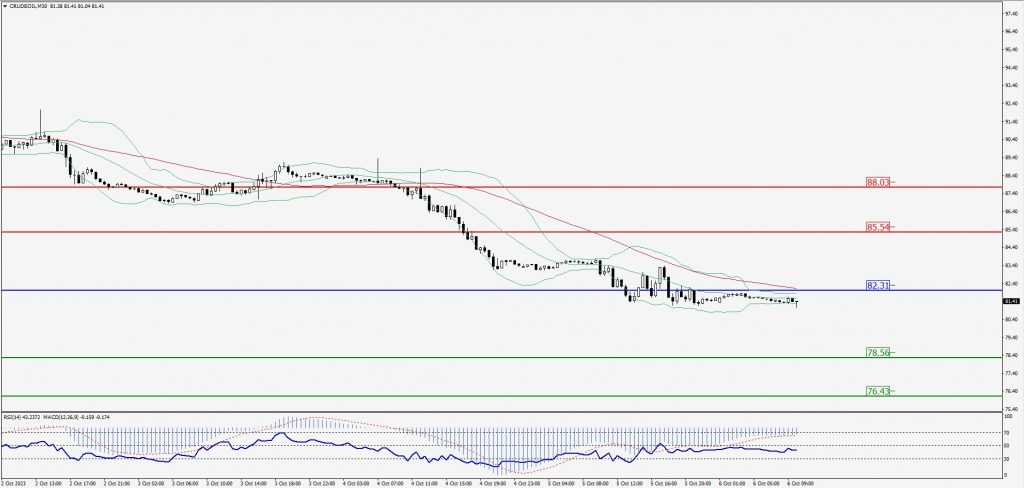
Green Lines Indicate Resistance Levels – Red Lines Indicate Support Levels
Light Blue is a Pivot Point – Black represents the price when the report was produced
XAU/USD Intraday: Resistance level at 1822.90
Our pivot point is 1822.90
Preferable Price Action: Further downside to 1812.00 and 1806.70.
Alternative Price Action: If the price gives an upside breakout of a pivot, then the price extends to 1833.90 and 1839.40.
Comment: MACD is below 50 level and Pairs below its 20MA & 55MA.
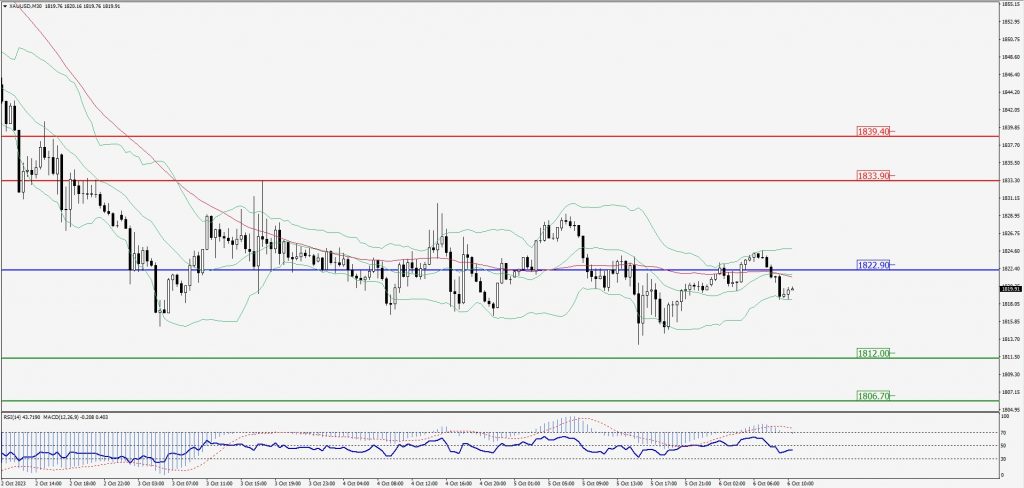
Green Lines Indicate Resistance Levels – Red Lines Indicate Support Levels
Light Blue is a Pivot Point – Black represents the price when the report was produced
Dow Jones Intraday: Support level at 33,064.00
Our pivot point is 33,064.00
Preferable Price Action: Take buy positions above the pivot with targets at 33,257.00 & 33,402.00.
Alternative Price Action: Below 33,064.00 looks for further downside to 32,889.00 & 32,783.00.
Comment: RSI is above 50 levels and Pairs above 55MA.
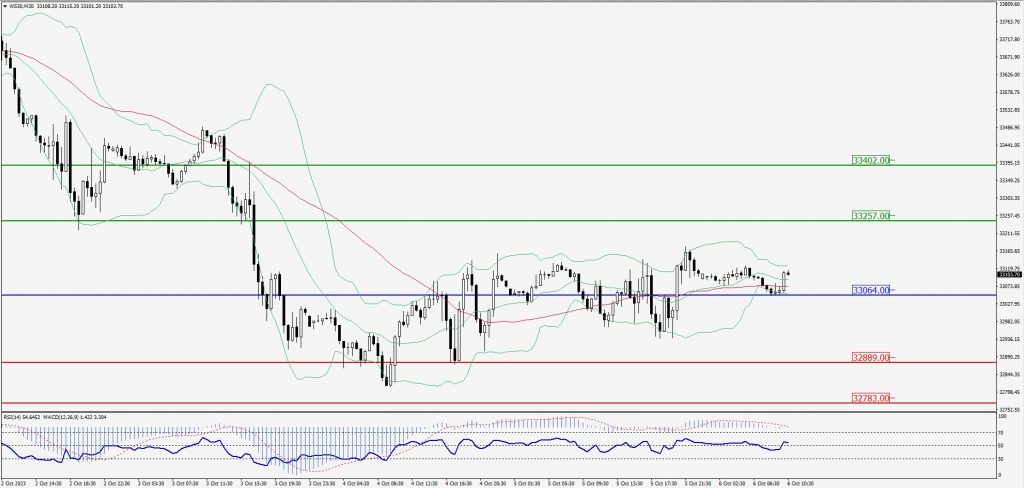
Green Lines Indicate Resistance Levels – Red Lines Indicate Support Levels
Light Blue is a Pivot Point – Black represents the price when the report was produced