Market Wrap: Stocks, Bonds, Commodities
Stock futures were near flat on Monday night as investors looked to the final days of what’s been a difficult August for the market.
The Dow Jones Industrial Average rose 213.08 points to 34,559.98, the S&P 500 gain 0.63% to 4,433.31 and the Nasdaq Composite add 114.49 points to 13,705.13.
MSCI’s index of Asia-Pacific stocks outside Japan is advance 0.98% to 623.31 levels. The Australian index was higher by 0.71% to 7,210.50. Japanese Nikkei Index ascend 0.10% today.
European stocks were positive on Tuesday, with the Stoxx Europe 50 Index rose 1.34% to 4,291.75, Germany’s DAX ascend 1.03% to 15,792.61, and France’s CAC advance 1.32% to 7,324.71 and U.K.’s FTSE 100 add 0.07% to 7,338.58.
Benchmark 10-year U.S. Treasury fell as demand for safe assets ascend again, today 10-year bond yields negative 0.78% to 4.1820.
Oil rose on Monday after China took steps to bolster its flagging economy, though investors remained worried about the pace of growth as well as further US interest rate hikes that could dampen demand.
Spot Brent crude oil drop 0.27% to $83.64 per barrel. US West Texas Intermediate crude is down 0.31% to $79.85 a barrel.
The yellow metal gold is advance 0.19% to 1,950.60 dollars per ounce.
Market Wrap: Forex
The dollar briefly hit a nine-month high against the Japanese yen on Monday and dipped against a basket of currencies, as investors waited on key data due later this week and kept an eye out for potential intervention to shore up the struggling Japanese currency.
Today, the U.S. dollar index measures the Greenback against a trade-weighted basket of six major currencies, which slipped 0.01% to 103.977.
The Euro US Dollar (EUR/USD) is a widely traded pair that is down 0.07% today. This left the pair trading around $1.08090.
The Japanese yen was negative against the U.S. dollar on Tuesday. Today USD/JPY is slipped 0.09% to the 146.420 level.
Another commodity-related currency positive against the U.S dollar, AUD/USD rose 0.22% to 0.64430, and NZD/USD surged 0.26% to 0.59250 level.
EUR/USD Intraday: Trend on the downside
Our pivot point is at 1.08270
Preferable Price Action: Take sell positions below pivot level with targets at 1.07980 & 1.07800 in extension.
Alternative Price Action: Above pivot looks for a further upside to 1.08500 & 1.08690.
Comment: RSI is below 50 levels and Pairs below 20MA.
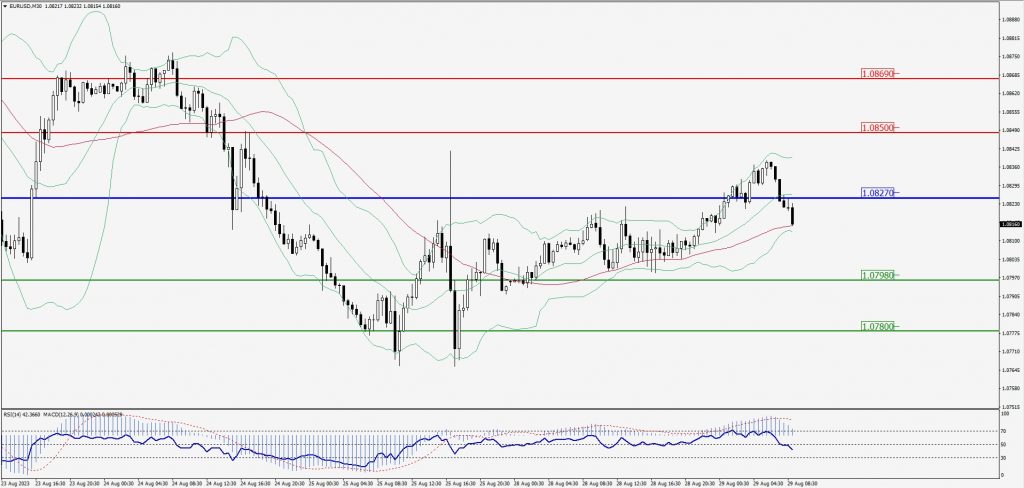
Green Lines Indicate Resistance Levels – Red Lines Indicate Support Levels
Light Blue is a Pivot Point – Black represents the price when the report was produced
GBP/USD Intraday: Trend on the upside
Our pivot point is at 1.26120
Preferable Price Action: Buy positions above pivot with targets at 1.26540 & 1.26840 in extension.
Alternative Price Action: The price below pivot would call for further downside to 1.25710 & 1.25430.
Comment: RSI is above 50 levels and Pairs above its 20MA & 55MA.
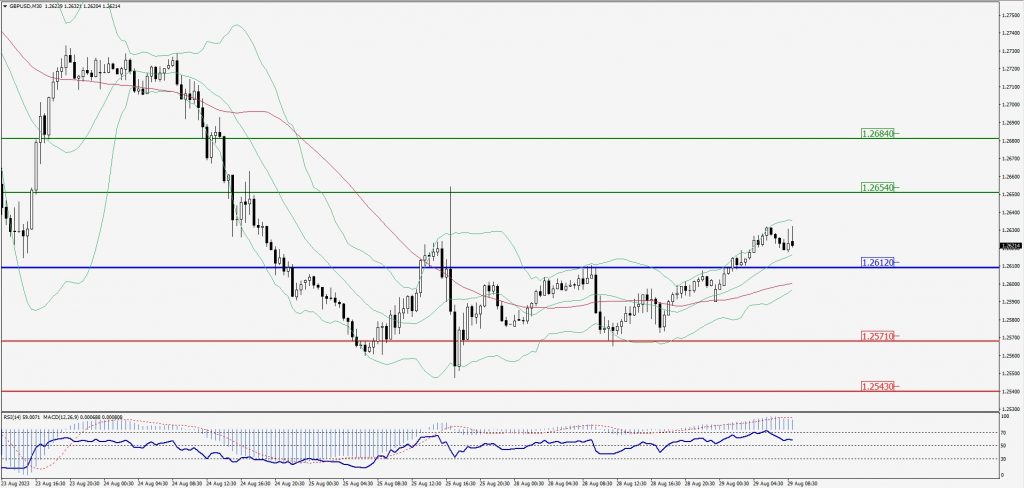
Green Lines Indicate Resistance Levels – Red Lines Indicate Support Levels
Light Blue is a Pivot Point – Black represents the price when the report was produced
USD/JPY Intraday: In a consolidation zone
Our pivot point is at 146.600
Preferable Price Action: Sell position below pivot with the target at 146.190 and 145.940 in extension.
Alternative Price Action: The upside breakout of the pivot would call for 146.970 and 147.210.
Comment: MACD is at 50 level and Pairs below 55MA.
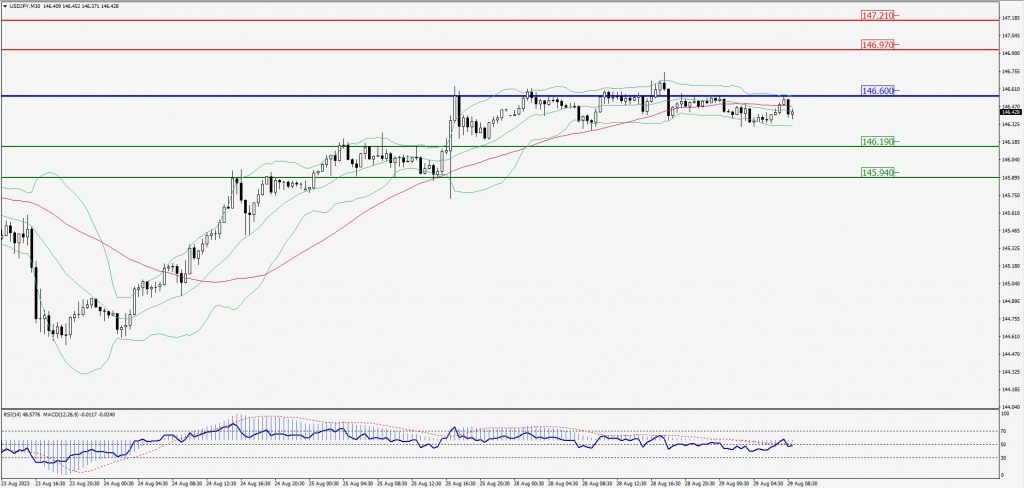
Green Lines Indicate Resistance Levels – Red Lines Indicate Support Levels
Light Blue is a Pivot Point – Black represents the price when the report was produced
AUD/USD Intraday: Trend on the upside
Our pivot point is at 0.64340
Preferable Price Action: Buy positions above pivot with targets at 0.64570 & 0.64710 in extension.
Alternative Price Action: Below pivot looks for a further downside with 0.64160 & 0.64020 as targets.
Comment: RSI is above 50 levels and Pairs above its 20MA & 55MA.
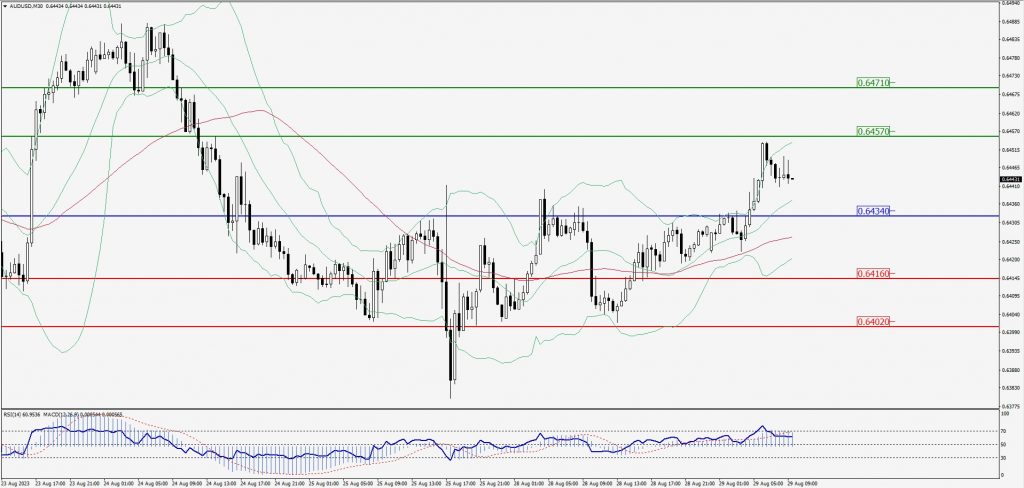
Green Lines Indicate Resistance Levels – Red Lines Indicate Support Levels
Light Blue is a Pivot Point – Black represents the price when the report was produced
CRUDEOIL Intraday: Major resistance level at 79.92
Our pivot point is at 79.92
Preferable Price Action: Below pivot sell oil with 79.29 & 78.88 as targets.
Alternative Price Action: Buy crude above pivot with targets at 80.52 and 80.92 in extension.
Comment: MACD is negative territory and Pairs below its 20MA & 55MA.
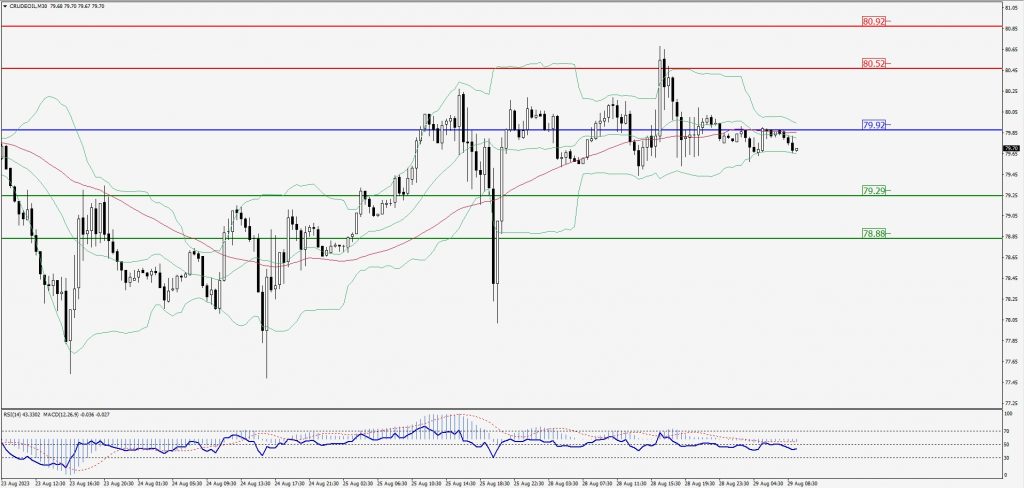
Green Lines Indicate Resistance Levels – Red Lines Indicate Support Levels
Light Blue is a Pivot Point – Black represents the price when the report was produced
XAU/USD Intraday: Trend on the upside
Our pivot point is 1922.70
Preferable Price Action: Further upside to 1927.20 and 1930.40.
Alternative Price Action: If the price gives a downside breakout of a pivot, then the price extends to 1918.00 and 1914.50.
Comment: MACD is above 50 level and Pairs above its 20MA & 55MA.
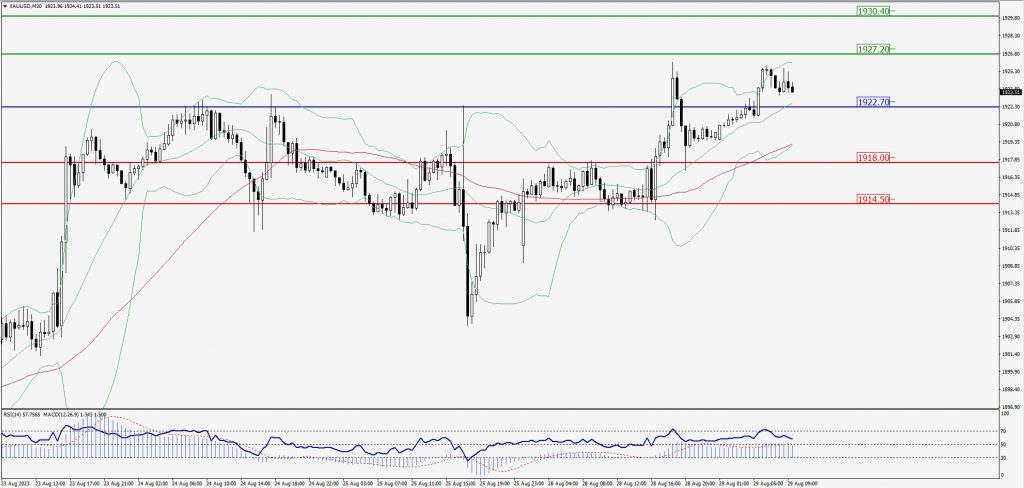
Green Lines Indicate Resistance Levels – Red Lines Indicate Support Levels
Light Blue is a Pivot Point – Black represents the price when the report was produced
Dow Jones Intraday: Trend on the upside
Our pivot point is 34,565.00
Preferable Price Action: Take buy positions above the pivot with targets at 34,670.00 & 34,750.00.
Alternative Price Action: Below 34,565.00 looks for further downside to 34,476.00 & 34,403.00.
Comment: RSI is above 50 levels and Pairs above its 20MA & 55MA.
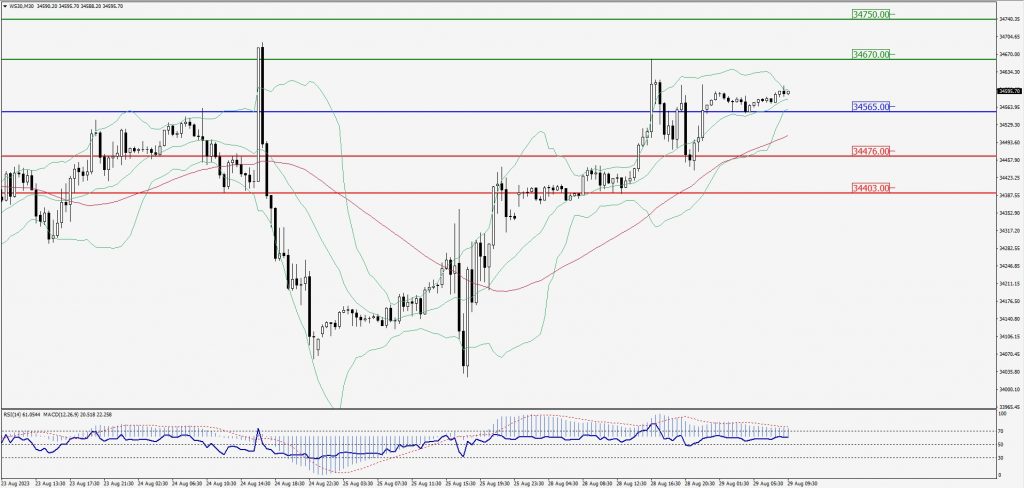
Green Lines Indicate Resistance Levels – Red Lines Indicate Support Levels
Light Blue is a Pivot Point – Black represents the price when the report was produced