Market Wrap: Stocks, Bonds, Commodities
The stock futures gained slightly to kick off the final trading week of August. Futures tied to the Dow Jones Industrial Average rose 50 points, or about 0.15 percent, while S&P 500 futures and Nasdaq-100 futures added 0.14 percent and 0.7 percent, respectively.
The Dow Jones Industrial Average rose 247.48 points to 34,346.90, the S&P 500 gain 0.67% to 4,405.71 and the Nasdaq Composite add 126.67 points to 13,590.65.
MSCI’s index of Asia-Pacific stocks outside Japan is advance 0.79% to 617.92 levels. The Australian index was higher by 0.63% to 7,159.80. Japanese Nikkei Index ascend 1.80% today.
European stocks were positive on Monday, with the Stoxx Europe 50 Index rose 0.99% to 4,277.05, Germany’s DAX ascend 0.82% to 15,756.05, and France’s CAC advance 0.94% to 7,296.66 and U.K.’s FTSE 100 add 0.07% to 7,338.58.
Benchmark 10-year U.S. Treasury fell as demand for safe assets ascend again, today 10-year bond yields negative 0.23% to 4.2330.
Oil futures climbed about 1% to a one-week high on Friday as U.S. diesel prices soared, the number of oil rigs dropped, and a fire broke out at a refinery in Louisiana.
Spot Brent crude oil ascend 0.26% to $84.17 per barrel. US West Texas Intermediate crude is up 0.46% to $80.20 a barrel.
The yellow metal gold is advacne 0.13% to 1,942.35 dollars per ounce.
Market Wrap: Forex
The dollar eased from a 12-week peak on Monday as traders weighed the U.S. monetary path after Fed Chair Jerome Powell left open the possibility of further interest rate increases, while the yen hovered close to its lowest in over nine months.
Today, the U.S. dollar index measures the Greenback against a trade-weighted basket of six major currencies, which slipped 0.01% to 104.002.
The Euro US Dollar (EUR/USD) is a widely traded pair that is up 0.14% today. This left the pair trading around $1.08160.
The Japanese yen was negative against the U.S. dollar on Monday. Today USD/JPY is surged 0.02% to the 146.440 level.
Another commodity-related currency mixed against the U.S dollar, AUD/USD rose 0.12% to 0.64070, and NZD/USD slipped 0.05% to 0.59010 level.
EUR/USD Intraday: Trend on the upside
Our pivot point is at 1.08050
Preferable Price Action: Take buy positions above pivot level with targets at 1.08400 & 1.08600 in extension.
Alternative Price Action: Below pivot looks for a further downside to 1.07700 & 1.07500.
Comment: RSI is above 50 levels and Pairs above its 20MA & 55MA.
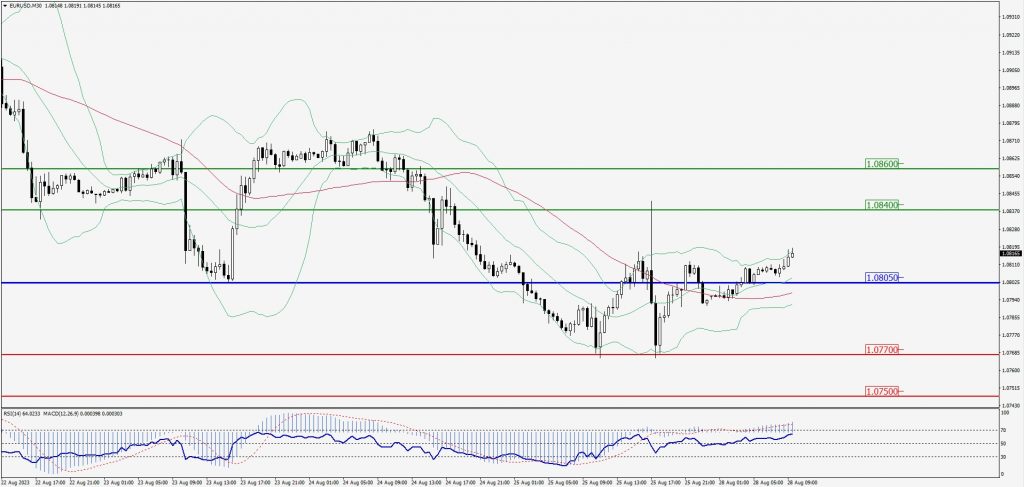
Green Lines Indicate Resistance Levels – Red Lines Indicate Support Levels
Light Blue is a Pivot Point – Black represents the price when the report was produced
GBP/USD Intraday: Support level at 1.25970
Our pivot point is at 1.25970
Preferable Price Action: Buy positions above pivot with targets at 1.26470 & 1.26780 in extension.
Alternative Price Action: The price below pivot would call for further downside to 1.25530 & 1.25260.
Comment: RSI is above 50 levels and Pairs above its 20MA & 55MA.
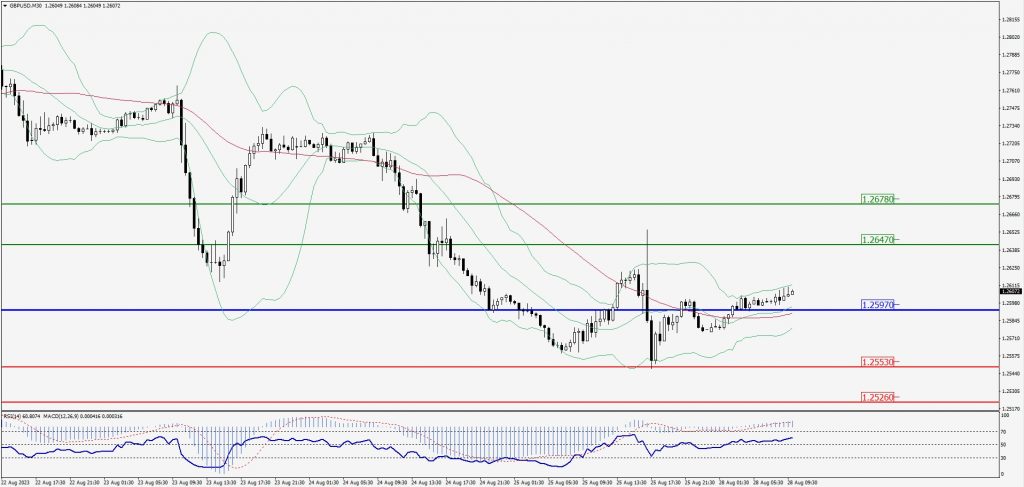
Green Lines Indicate Resistance Levels – Red Lines Indicate Support Levels
Light Blue is a Pivot Point – Black represents the price when the report was produced
USD/JPY Intraday: Resistance level at 146.430
Our pivot point is at 146.430
Preferable Price Action: Sell position below pivot with the target at 146.110 and 145.870 in extension.
Alternative Price Action: The upside breakout of the pivot would call for 146.740 and 146.980.
Comment: MACD is below 50 level and Pairs below 20MA.
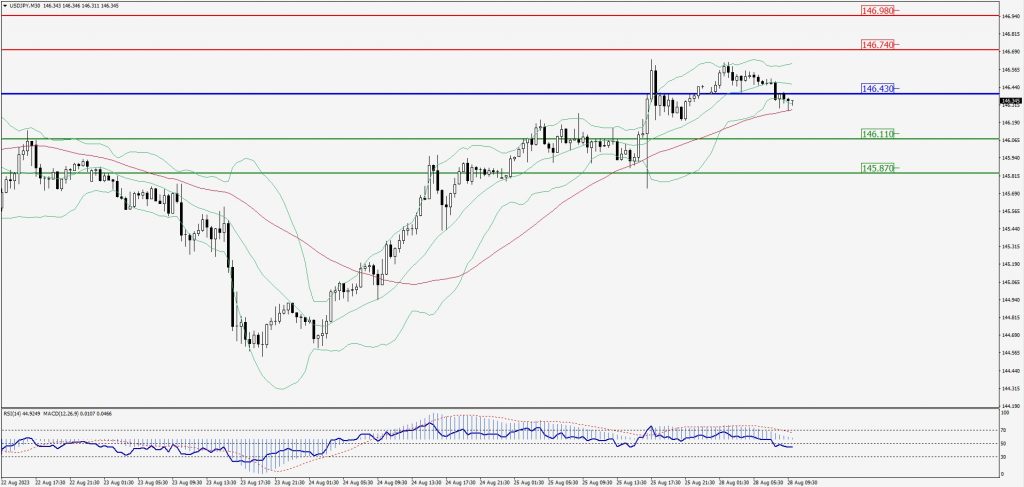
Green Lines Indicate Resistance Levels – Red Lines Indicate Support Levels
Light Blue is a Pivot Point – Black represents the price when the report was produced
AUD/USD Intraday: In a consolidation zone
Our pivot point is at 0.64190
Preferable Price Action: Buy positions above pivot with targets at 0.64390 & 0.64540 in extension.
Alternative Price Action: Below pivot looks for a further downside with 0.64010 & 0.63870 as targets.
Comment: RSI is at 50 levels and Pairs above 55MA.
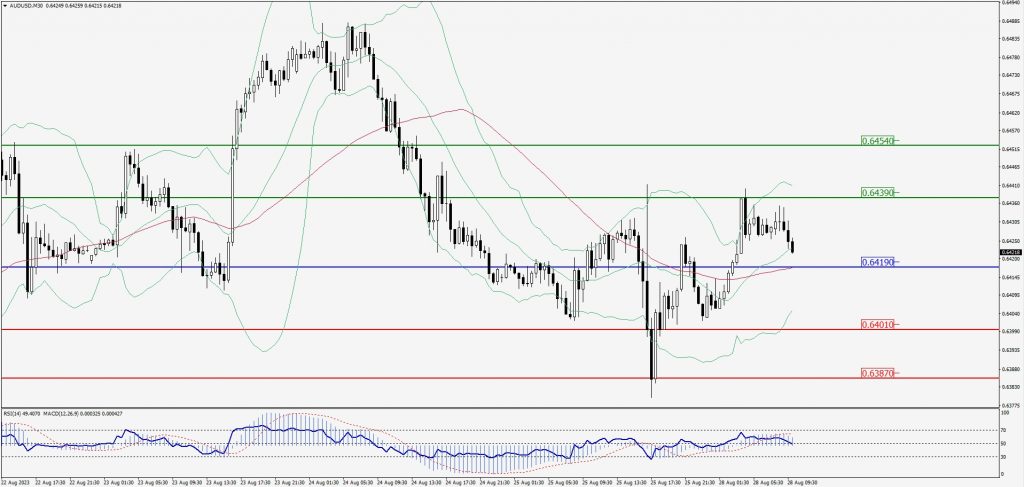
Green Lines Indicate Resistance Levels – Red Lines Indicate Support Levels
Light Blue is a Pivot Point – Black represents the price when the report was produced
CRUDEOIL Intraday: Trend on the upside
Our pivot point is at 79.80
Preferable Price Action: Above pivot buy oil with 80.54 & 81.11 as targets.
Alternative Price Action: Sell crude below pivot with targets at 79.14 and 78.62 in extension.
Comment: MACD is positive territory and Pairs above its 20MA & 55MA.
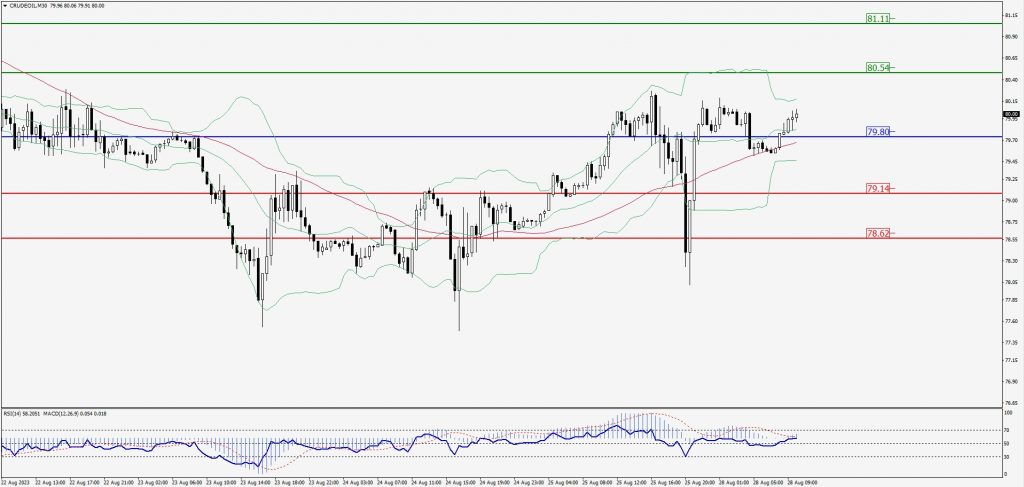
Green Lines Indicate Resistance Levels – Red Lines Indicate Support Levels
Light Blue is a Pivot Point – Black represents the price when the report was produced
XAU/USD Intraday: Major support level at 1914.90
Our pivot point is 1914.90
Preferable Price Action: Further upside to 1921.40 and 1926.30.
Alternative Price Action: If the price gives a downside breakout of a pivot, then the price extends to 1909.20 and 1904.60.
Comment: MACD is above 50 level and Pairs above 55MA.
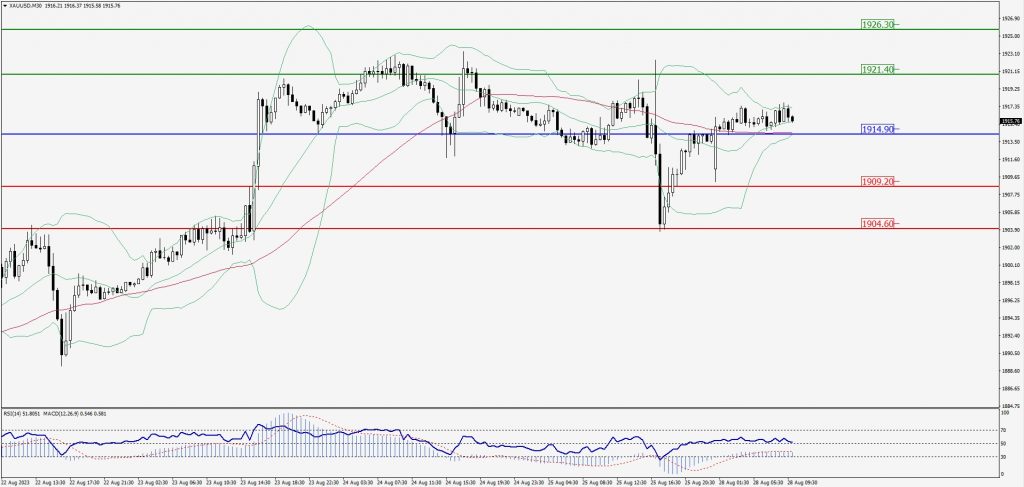
Green Lines Indicate Resistance Levels – Red Lines Indicate Support Levels
Light Blue is a Pivot Point – Black represents the price when the report was produced
Dow Jones Intraday: Trend on the upside
Our pivot point is 34,396.00
Preferable Price Action: Take buy positions above the pivot with targets at 34,529.00 & 34,635.00.
Alternative Price Action: Below 34,396.00 looks for further downside to 34,281.00 & 34,190.00.
Comment: RSI is above 50 levels and Pairs above its 20MA & 55MA.
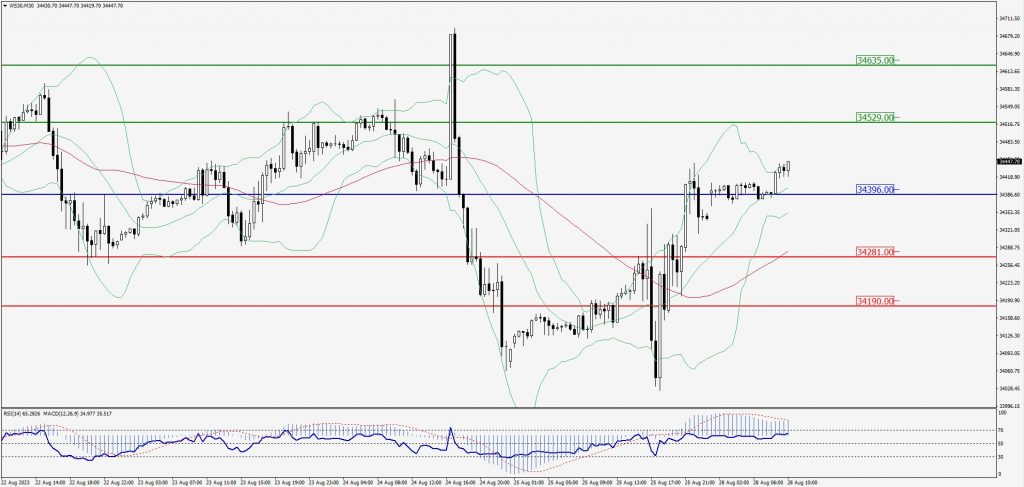
Green Lines Indicate Resistance Levels – Red Lines Indicate Support Levels
Light Blue is a Pivot Point – Black represents the price when the report was produced