Market Wrap: Stocks, Bonds, Commodities
US stock futures traded flat Monday night Indian time as the Nasdaq Composite and the S&P 500 snapped a four-day negative streak, in what has been a losing month for all the major averages.
The Dow Jones Industrial Average fell 36.97 points to 34,463.69, the S&P 500 gain 0.69% to 4,399.77 and the Nasdaq Composite add 206.81 points to 13,497.59.
MSCI’s index of Asia-Pacific stocks outside Japan is advance 0.95% to 611.74 levels. The Australian index was higher by 0.09% to 7,121.60. Japanese Nikkei Index ascend 1.05% today.
European stocks were positive on Tuesday, with the Stoxx Europe 50 Index rose 0.82% to 4,256.35, Germany’s DAX ascend 0.74% to 15,717.55, and France’s CAC advance 0.58% to 7,239.77 and U.K.’s FTSE 100 add 0.12% to 7,267.53.
Benchmark 10-year U.S. Treasury fell as demand for safe assets ascend again, today 10-year bond yields negative 0.09% to 4.3380.
Oil prices edged higher on Monday as tighter supply reflected in fewer exports from Saudi Arabia and Russia and high heating oil prices outweighed concern over global demand growth.
Spot Brent crude oil drop 0.20% to $84.29 per barrel. US West Texas Intermediate crude is down 0.12% to $80.00 a barrel.
The yellow metal gold is advance 0.30% to 1,928.75 dollars per ounce.
Market Wrap: Forex
The U.S. dollar eased back from a 10-week peak versus major peers on Tuesday, even as Treasury yields marched to fresh post-financial crisis highs, as traders awaited a potentially crucial speech from Federal Reserve Chair Jerome Powell later this week.
Today, the U.S. dollar index measures the Greenback against a trade-weighted basket of six major currencies, which slipped 0.21% to 102.989.
The Euro US Dollar (EUR/USD) is a widely traded pair that is up 0.30% today. This left the pair trading around $1.09240.
The Japanese yen was negative against the U.S. dollar on Tuesday. Today USD/JPY is slipped 0.25% to the 145.810 level.
Another commodity-related currency positive against the U.S dollar, AUD/USD rose 0.45% to 0.64410, and NZD/USD surged 0.57% to 0.59160 level.
EUR/USD Intraday: Support level at 1.09080
Our pivot point is at 1.09080
Preferable Price Action: Take buy positions above pivot level with targets at 1.09340 & 1.09500 in extension.
Alternative Price Action: Below pivot looks for a further downside to 1.08850 & 1.08670.
Comment: RSI is above 50 levels and Pairs above its 20MA & 55MA.
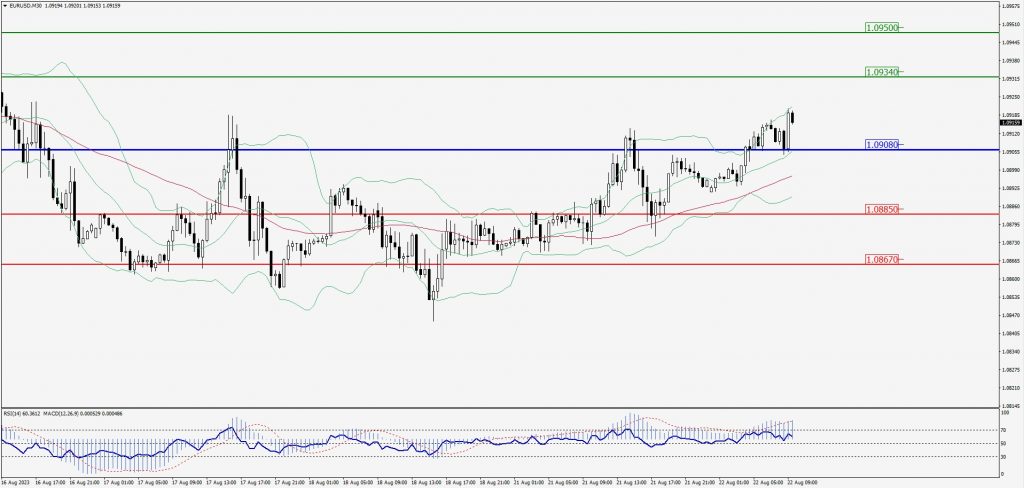
Green Lines Indicate Resistance Levels – Red Lines Indicate Support Levels
Light Blue is a Pivot Point – Black represents the price when the report was produced
GBP/USD Intraday: Trend on the upside
Our pivot point is at 1.27770
Preferable Price Action: Buy positions above pivot with targets at 1.28040 & 1.28200 in extension.
Alternative Price Action: The price below pivot would call for further downside to 1.2753 & 1.27350.
Comment: RSI is above 50 levels and Pairs above its 20MA & 55MA.
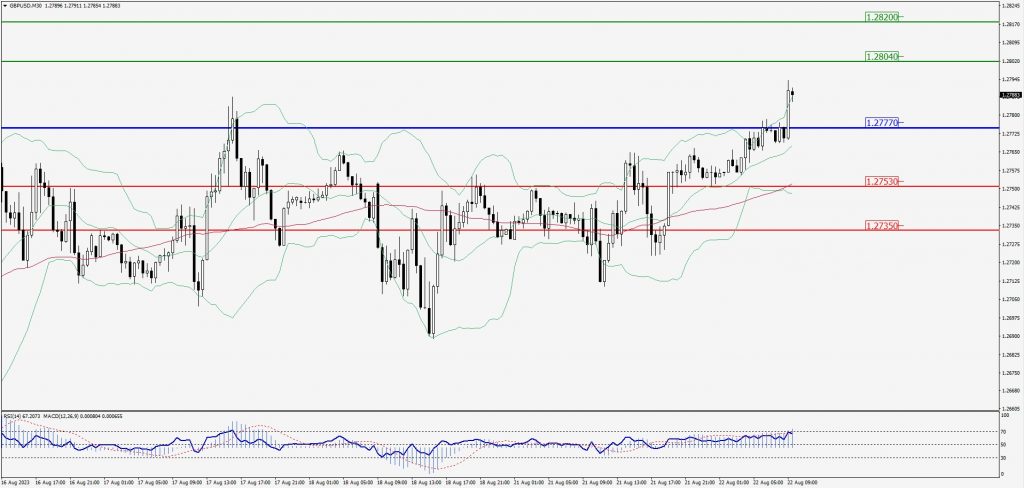
Green Lines Indicate Resistance Levels – Red Lines Indicate Support Levels
Light Blue is a Pivot Point – Black represents the price when the report was produced
USD/JPY Intraday: Trend on the downside
Our pivot point is at 146.050
Preferable Price Action: Sell position below pivot with the target at 145.580 and 145.270 in extension.
Alternative Price Action: The upside breakout of the pivot would call for 146.480 and 146.830.
Comment: MACD is below 50 level and Pairs below 20MA.
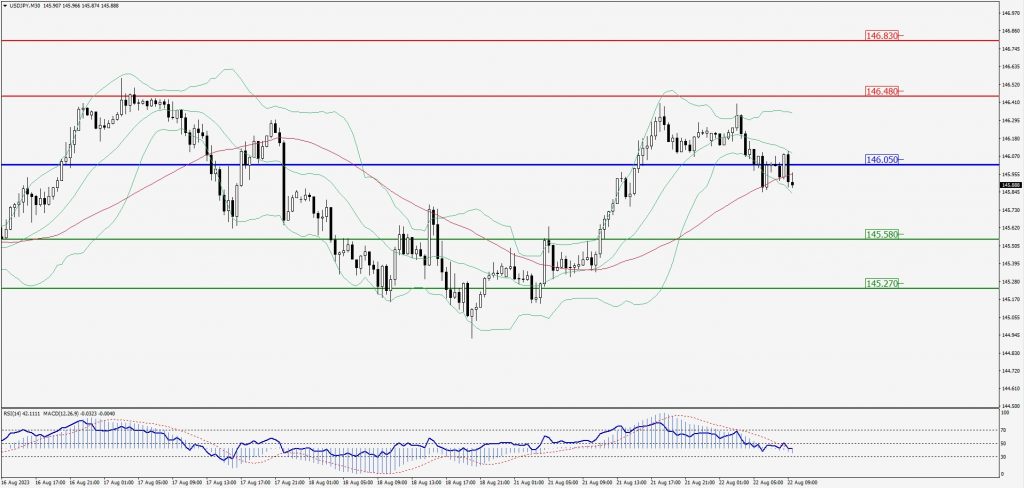
Green Lines Indicate Resistance Levels – Red Lines Indicate Support Levels
Light Blue is a Pivot Point – Black represents the price when the report was produced
AUD/USD Intraday: Trend on the upside
Our pivot point is at 0.64260
Preferable Price Action: Buy positions above pivot with targets at 0.64530 & 0.64710 in extension.
Alternative Price Action: Below pivot looks for a further downside with 0.64020 & 0.63850 as targets.
Comment: RSI is above 50 levels and Pairs above its 20MA & 55MA.
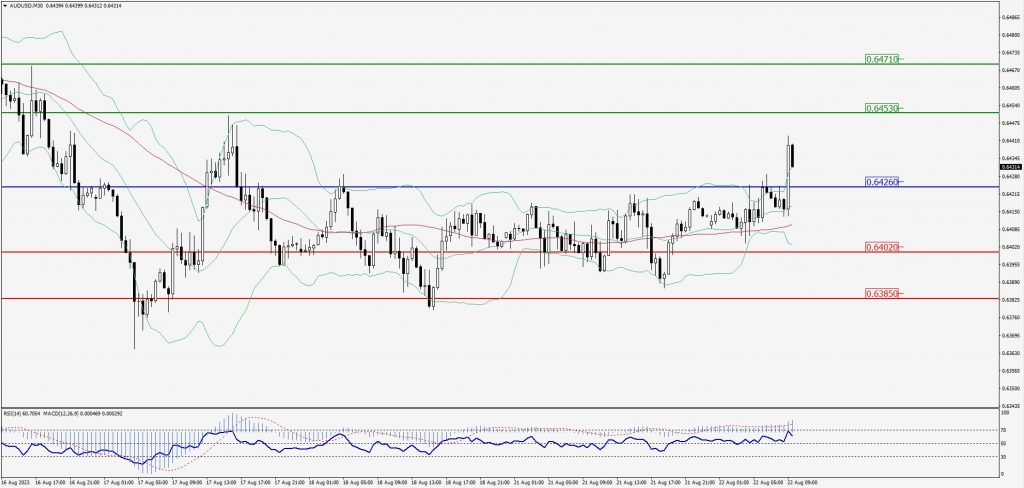
Green Lines Indicate Resistance Levels – Red Lines Indicate Support Levels
Light Blue is a Pivot Point – Black represents the price when the report was produced
CRUDEOIL Intraday: Resistance level at 80.17
Our pivot point is at 80.17
Preferable Price Action: Below pivot sell oil with 79.47 & 78.96 as targets.
Alternative Price Action: Buy crude above pivot with targets at 80.80 and 81.26 in extension.
Comment: MACD is negative territory and Pairs below 55MA.
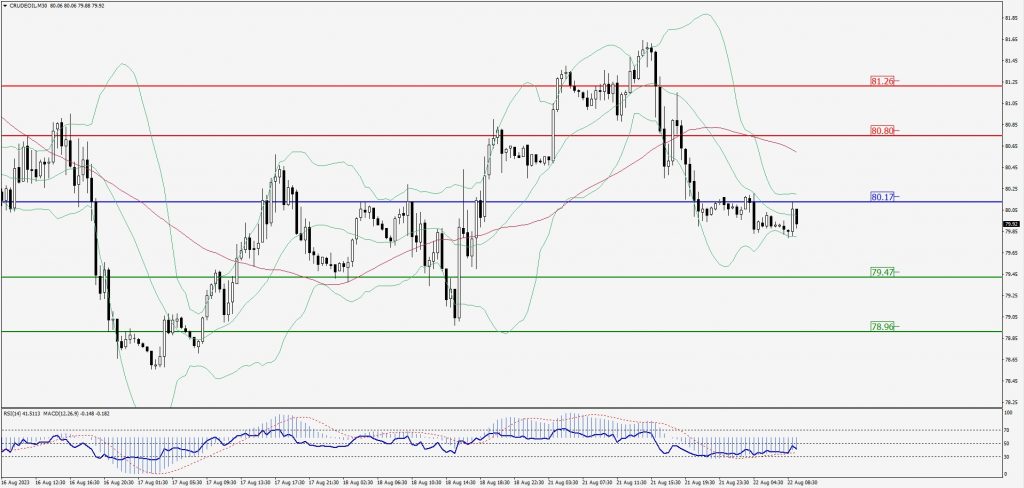
Green Lines Indicate Resistance Levels – Red Lines Indicate Support Levels
Light Blue is a Pivot Point – Black represents the price when the report was produced
XAU/USD Intraday: Trend on the upside
Our pivot point is 1895.80
Preferable Price Action: Further upside to 1901.70 and 1905.90.
Alternative Price Action: If the price gives a downside breakout of a pivot, then the price extends to 1890.10 and 1886.30.
Comment: MACD is above 50 level and Pairs above its 20MA & 55MA.
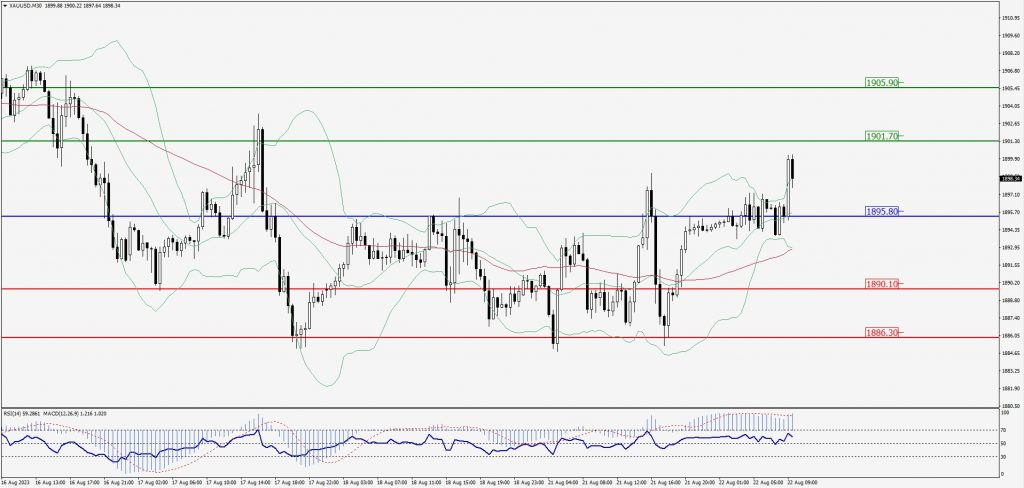
Green Lines Indicate Resistance Levels – Red Lines Indicate Support Levels
Light Blue is a Pivot Point – Black represents the price when the report was produced
Dow Jones Intraday: Trend on the upside
Our pivot point is 34,428.00
Preferable Price Action: Take buy positions above the pivot with targets at 34,615.00 & 34,763.00.
Alternative Price Action: Below 34,428.00 looks for further downside to 34,246.00 & 34,131.00.
Comment: RSI is above 50 levels and Pairs above 20MA.
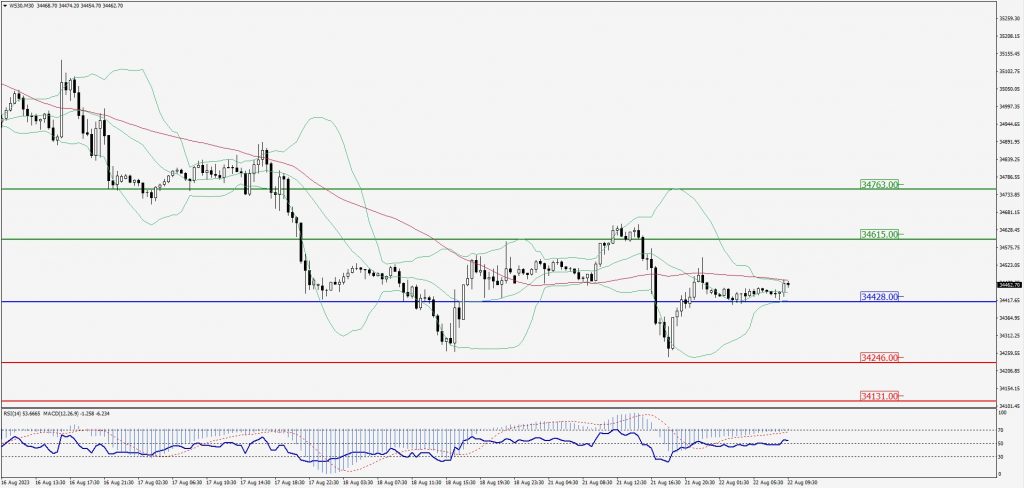
Green Lines Indicate Resistance Levels – Red Lines Indicate Support Levels
Light Blue is a Pivot Point – Black represents the price when the report was produced