Market Wrap: Stocks, Bonds, Commodities
U.S. stock futures were trading slightly higher during Sunday’s evening deals, following a weekly decline among benchmark averages as monitored, rising bond yields, and continued economic weakness in China.
The Dow Jones Industrial Average rose 25.83 points to 34,474.83, the S&P 500 lose 0.01% to 4,369.71 and the Nasdaq Composite subtract 26.16 points to 13,290.78.
MSCI’s index of Asia-Pacific stocks outside Japan is decline 0.79% to 605.38 levels. The Australian index was lower by 0.46% to 7,115.50. Japanese Nikkei Index ascend 0.29% today.
European stocks were positive on Monday, with the Stoxx Europe 50 Index rose 1.11% to 4,259.75, Germany’s DAX ascend 0.81% to 15,699.95, and France’s CAC advance 1.19% to 7,249.68 and U.K.’s FTSE 100 add 0.98% to 7,311.43.
Benchmark 10-year U.S. Treasury fell as demand for safe assets ascend again, today 10-year bond yields positive 1.03% to 4.2940.
Oil prices rose about 1 percent on Friday on signs of slowing US output, but both crude benchmarks also ended their longest weekly rally of 2023 on mounting concerns about global demand growth.
Spot Brent crude oil ascend 0.62% to $85.32 per barrel. US West Texas Intermediate crude is up 0.66% to $81.19 a barrel.
The yellow metal gold is advance 0.09% to 1,918.05 dollars per ounce.
Market Wrap: Forex
The U.S. dollar slipped lower in early European trade Friday, retreating from two-month highs but is still on course for a fifth consecutive winning week as a resilient U.S. economy suggested higher rates for longer.
Today, the U.S. dollar index measures the Greenback against a trade-weighted basket of six major currencies, which slipped 0.06% to 103.219.
The Euro US Dollar (EUR/USD) is a widely traded pair that is up 0.21% today. This left the pair trading around $1.08960.
The Japanese yen was negative against the U.S. dollar on Monday. Today USD/JPY is surged 0.29% to the 145.790 level.
Another commodity-related currency mixed against the U.S dollar, AUD/USD rose 0.06% to 0.64070, and NZD/USD slipped 0.08% to 0.59160 level.
EUR/USD Intraday: Resistance level at 1.08850
Our pivot point is at 1.08850
Preferable Price Action: Take sell positions below pivot level with targets at 1.08580 & 1.08410 in extension.
Alternative Price Action: Above pivot looks for a further upside to 1.09070 & 1.09250.
Comment: RSI is at 50 levels.
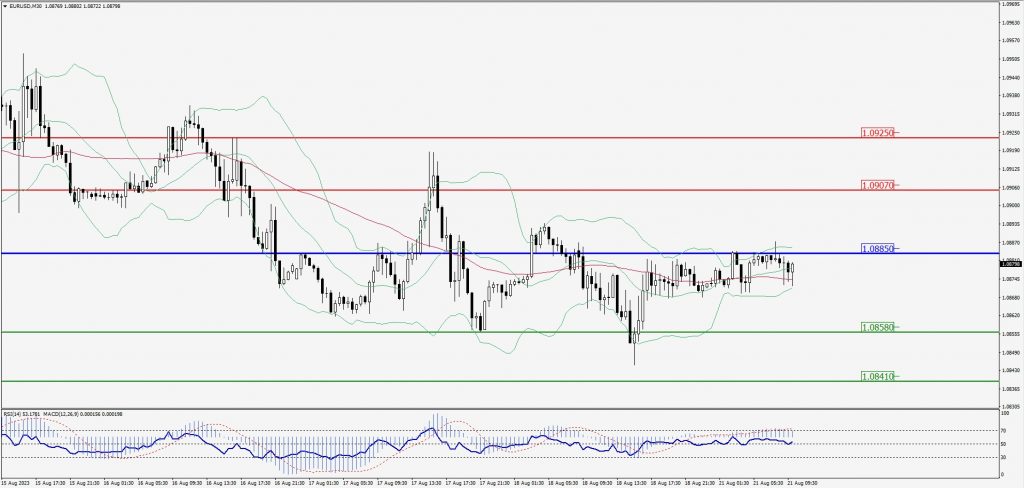
Green Lines Indicate Resistance Levels – Red Lines Indicate Support Levels
Light Blue is a Pivot Point – Black represents the price when the report was produced
GBP/USD Intraday: Trend on the downside
Our pivot point is at 1.27440
Preferable Price Action: Sell positions below pivot with targets at 1.27050 & 1.26720 in extension.
Alternative Price Action: The price above pivot would call for further upside to 1.27880 & 1.28190.
Comment: RSI is below 50 levels and Pairs below its 20MA & 55MA.
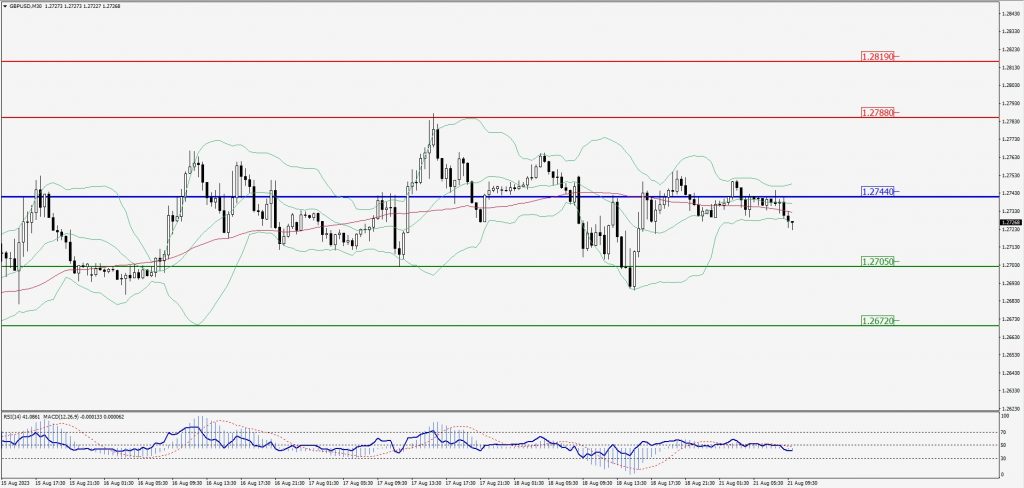
Green Lines Indicate Resistance Levels – Red Lines Indicate Support Levels
Light Blue is a Pivot Point – Black represents the price when the report was produced
USD/JPY Intraday: Support level at 145.380
Our pivot point is at 145.380
Preferable Price Action: Buy position above pivot with the target at 145.790 and 146.070 in extension.
Alternative Price Action: The downside breakout of the pivot would call for 144.980 and 144.750.
Comment: MACD is above 50 level and Pairs above its 20MA & 55MA.
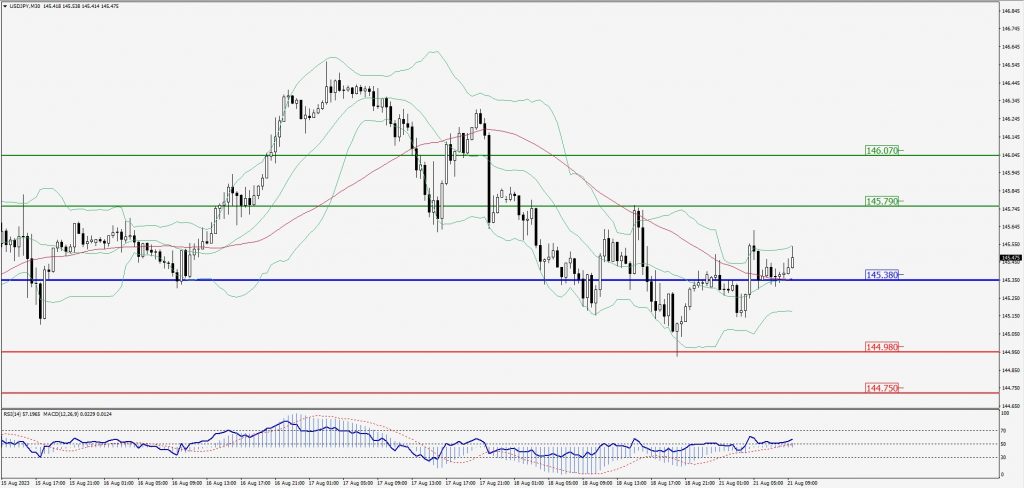
Green Lines Indicate Resistance Levels – Red Lines Indicate Support Levels
Light Blue is a Pivot Point – Black represents the price when the report was produced
AUD/USD Intraday: Trend on the downside
Our pivot point is at 0.64130
Preferable Price Action: Sell positions below pivot with targets at 0.63850 & 0.63610 in extension.
Alternative Price Action: Above pivot looks for a further upside with 0.64400 & 0.64650 as targets.
Comment: RSI is below 50 levels and Pairs below its 20MA & 55MA.
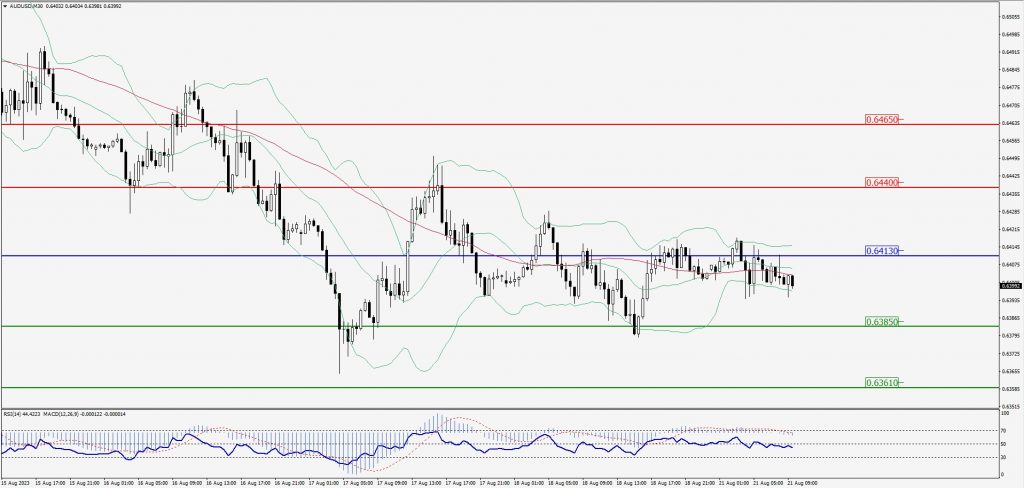
Green Lines Indicate Resistance Levels – Red Lines Indicate Support Levels
Light Blue is a Pivot Point – Black represents the price when the report was produced
CRUDEOIL Intraday: Trend on the upside
Our pivot point is at 80.89
Preferable Price Action: Above pivot buy oil with 81.85 & 82.58 as targets.
Alternative Price Action: Sell crude below pivot with targets at 80.04 and 79.38 in extension.
Comment: MACD is positive territory and Pairs above its 20MA & 55MA.
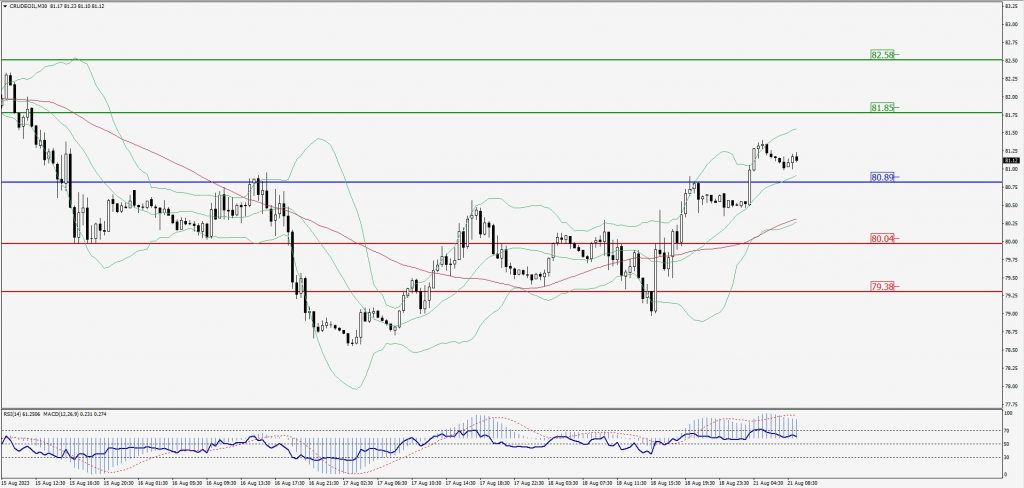
Green Lines Indicate Resistance Levels – Red Lines Indicate Support Levels
Light Blue is a Pivot Point – Black represents the price when the report was produced
XAU/USD Intraday: Trend on the downside
Our pivot point is 1891.30
Preferable Price Action: Further downside to 1848.80 and 1880.40.
Alternative Price Action: If the price gives an upside breakout of a pivot, then the price extends to 1897.20 and 1901.60.
Comment: MACD is below 50 level and Pairs below its 20MA & 55MA.
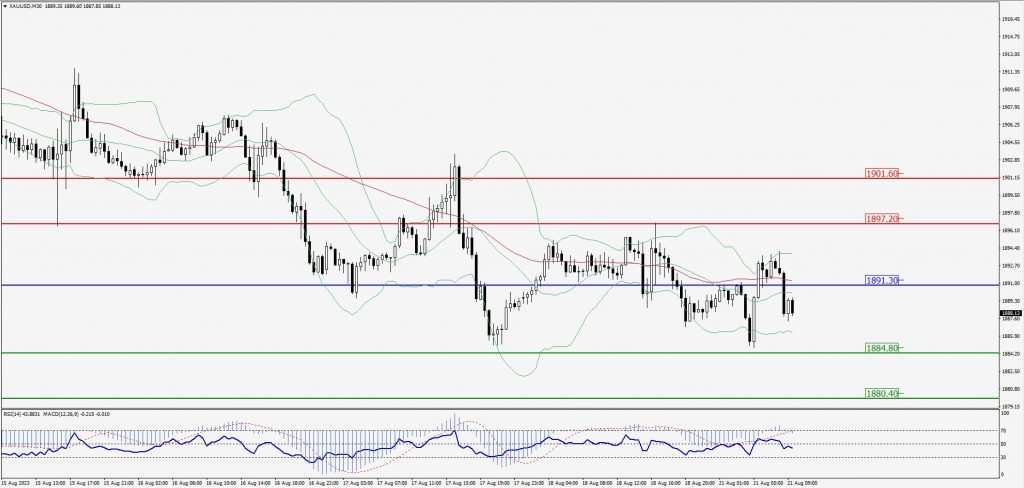
Green Lines Indicate Resistance Levels – Red Lines Indicate Support Levels
Light Blue is a Pivot Point – Black represents the price when the report was produced
Dow Jones Intraday: In a consolidation zone
Our pivot point is 34,558.00
Preferable Price Action: Take sell positions above the pivot with targets at 34,306.00 & 34,153.00.
Alternative Price Action: Above 34,558.00 looks for further upside to 34,767.00 & 34,920.00.
Comment: RSI is below 50 levels and Pairs below 20MA.
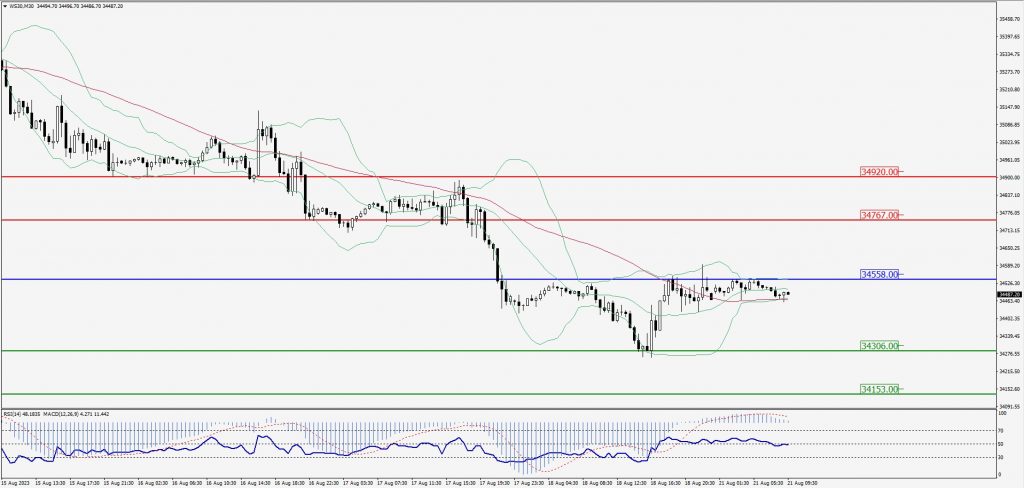
Green Lines Indicate Resistance Levels – Red Lines Indicate Support Levels
Light Blue is a Pivot Point – Black represents the price when the report was produced