Market Wrap: Stocks, Bonds, Commodities
U.S. stock futures remained little changed during Thursday’s evening trade after major benchmark indices extended declines for the third consecutive session as higher bond yields soured risk sentiment.
The Dow Jones Industrial Average fell 290.91 points to 34,474.83, the S&P 500 lose 0.77% to 4,370.36 and the Nasdaq Composite subtract 157.70 points to 13,316.93.
MSCI’s index of Asia-Pacific stocks outside Japan is decline 1.00% to 611.52 levels. The Australian index was higher by 0.03% to 7,148.10. Japanese Nikkei Index drop 0.43% today.
European stocks were negative on Friday, with the Stoxx Europe 50 Index fell 0.72% to 4,196.35, Germany’s DAX drop 0.75% to 15,558.85, and France’s CAC decline 0.87% to 7,127.99 and U.K.’s FTSE 100 subtract 0.79% to 7,252.34.
Benchmark 10-year U.S. Treasury fell as demand for safe assets ascend again, today 10-year bond yields negative 1.71% to 4.2360.
Oil prices rose more than 1% on Thursday after China’s central bank sought to stem the rising tide of pessimism over the country’s property market and wider economy.
Spot Brent crude oil ascend 0.12% to $84.22 per barrel. US West Texas Intermediate crude is up 0.25% to $80.59 a barrel.
The yellow metal gold is decline 0.14% to 1,921.25 dollars per ounce.
Market Wrap: Forex
The U.S. dollar slipped lower in early European trade Friday, retreating from two-month highs but is still on course for a fifth consecutive winning week as a resilient U.S. economy suggested higher rates for longer.
Today, the U.S. dollar index measures the Greenback against a trade-weighted basket of six major currencies, which slipped 0.11% to 103.352.
The Euro US Dollar (EUR/USD) is a widely traded pair that is flat 0.01% today. This left the pair trading around $1.08710.
The Japanese yen was negative against the U.S. dollar on Friday. Today USD/JPY is slipped 0.19% to the 145.560 level.
Another commodity-related currency mixed against the U.S dollar, AUD/USD fell 0.06% to 0.63980, and NZD/USD surged 0.05% to 0.59260 level.
EUR/USD Intraday: Trend on the downside
Our pivot point is at 1.08800
Preferable Price Action: Take sell positions below pivot level with targets at 1.08470 & 1.08260 in extension.
Alternative Price Action: Above pivot looks for a further upside to 1.09060 & 1.09270.
Comment: RSI is below 50 levels and Pairs below its 20MA & 55MA.
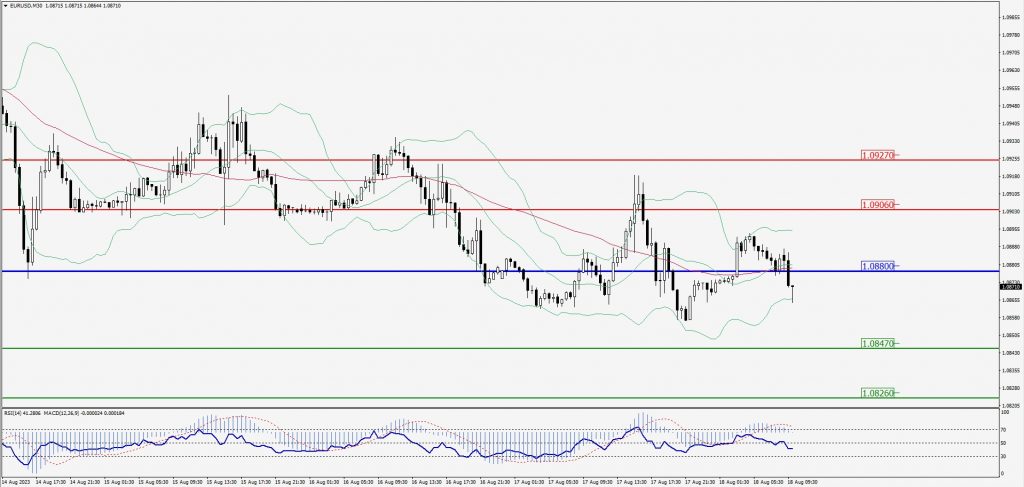
Green Lines Indicate Resistance Levels – Red Lines Indicate Support Levels
Light Blue is a Pivot Point – Black represents the price when the report was produced
GBP/USD Intraday: Major trend on the downside
Our pivot point is at 1.27350
Preferable Price Action: Sell positions below pivot with targets at 1.26880 & 1.26590 in extension.
Alternative Price Action: The price above pivot would call for further upside to 1.27830 & 1.28180.
Comment: RSI is below 50 levels and Pairs below its 20MA & 55MA.
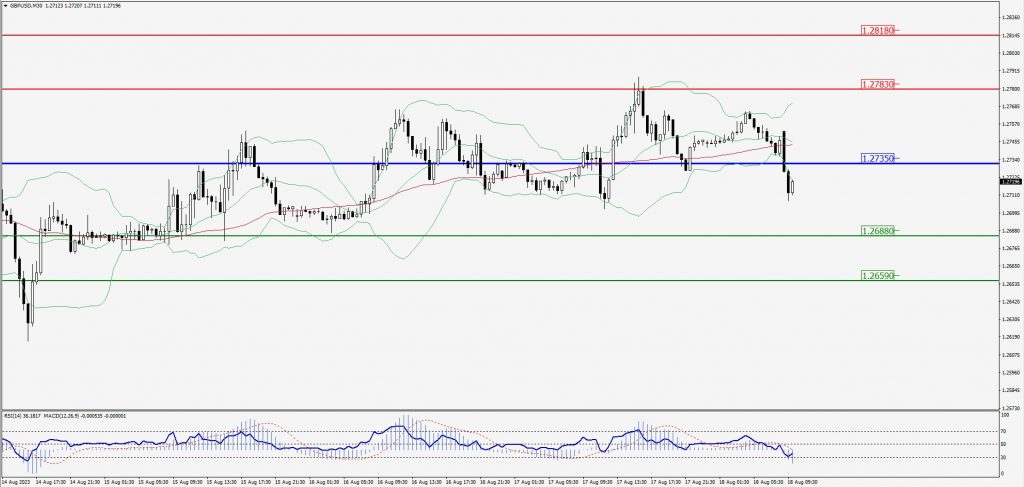
Green Lines Indicate Resistance Levels – Red Lines Indicate Support Levels
Light Blue is a Pivot Point – Black represents the price when the report was produced
USD/JPY Intraday: Trend on the downside
Our pivot point is at 145.480
Preferable Price Action: Sell position below pivot with the target at 145.030 and 144.750 in extension.
Alternative Price Action: The upside breakout of the pivot would call for 145.880 and 146.170.
Comment: MACD is below 50 level and Pairs below its 20MA & 55MA.
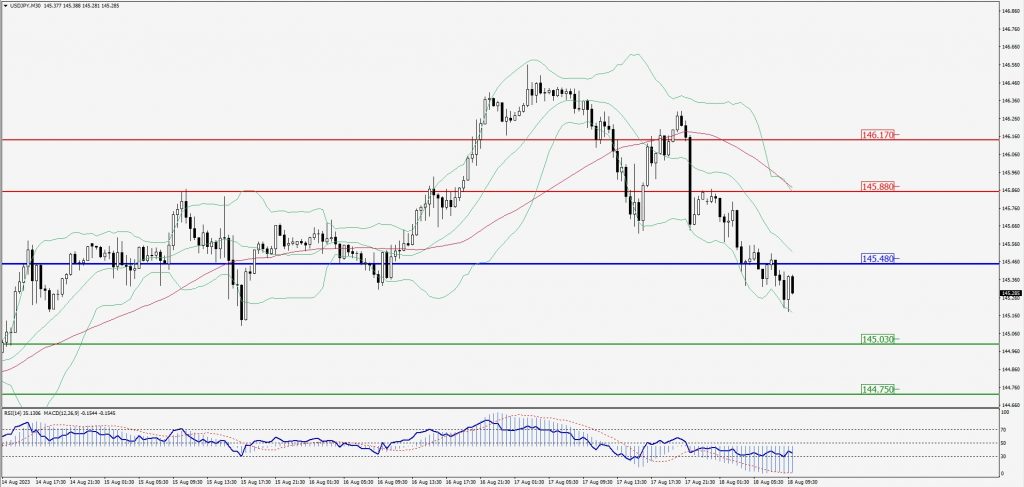
Green Lines Indicate Resistance Levels – Red Lines Indicate Support Levels
Light Blue is a Pivot Point – Black represents the price when the report was produced
AUD/USD Intraday: In a consolidation zone
Our pivot point is at 0.64050
Preferable Price Action: Buy positions above pivot with targets at 0.64420 & 0.64700 in extension.
Alternative Price Action: Below pivot looks for a further downside with 0.63690 & 0.63410 as targets.
Comment: RSI is at 50 levels.
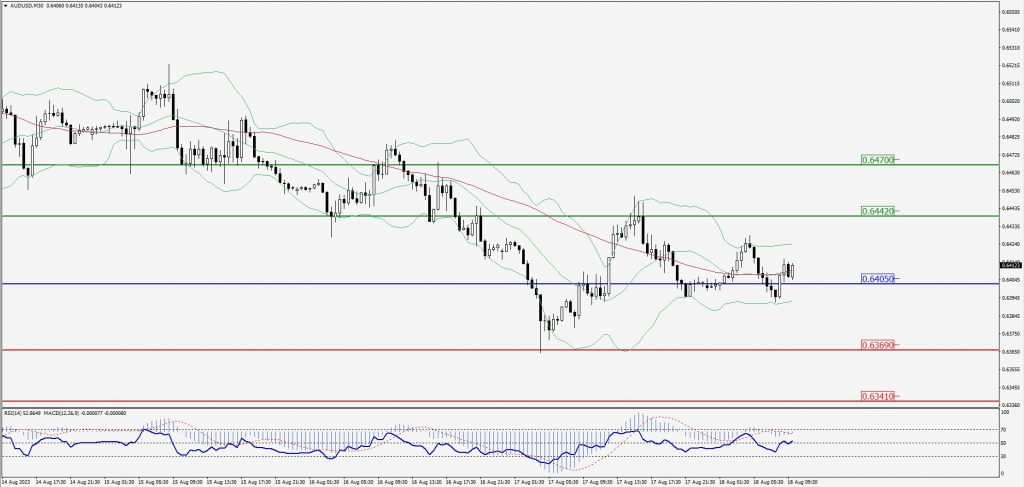
Green Lines Indicate Resistance Levels – Red Lines Indicate Support Levels
Light Blue is a Pivot Point – Black represents the price when the report was produced
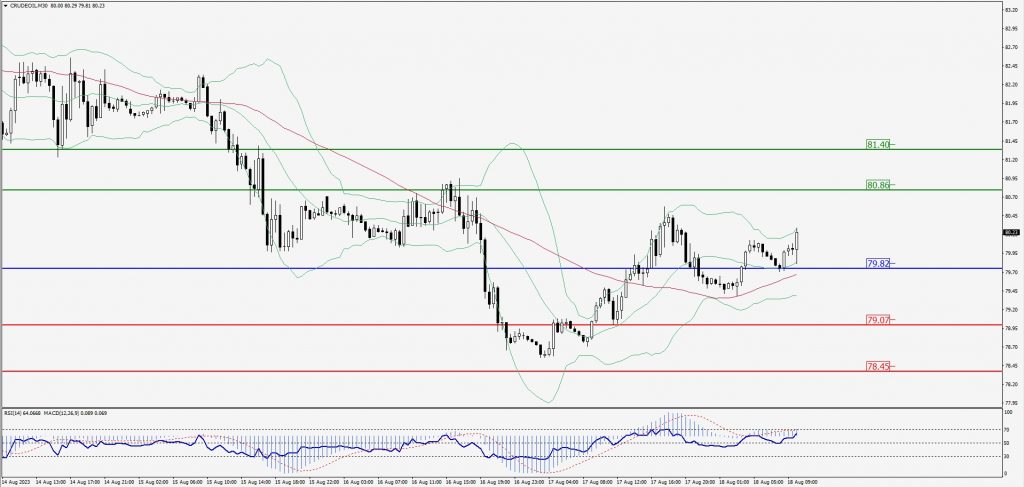
CRUDEOIL Intraday: Trend on the upside
Our pivot point is at 79.82
Preferable Price Action: Above pivot buy oil with 80.86 & 81.40 as targets.
Alternative Price Action: Sell crude below pivot with targets at 79.07 and 78.45 in extension.
Comment: MACD is positive territory and Pairs above its 20MA & 55MA.
Green Lines Indicate Resistance Levels – Red Lines Indicate Support Levels
Light Blue is a Pivot Point – Black represents the price when the report was produced
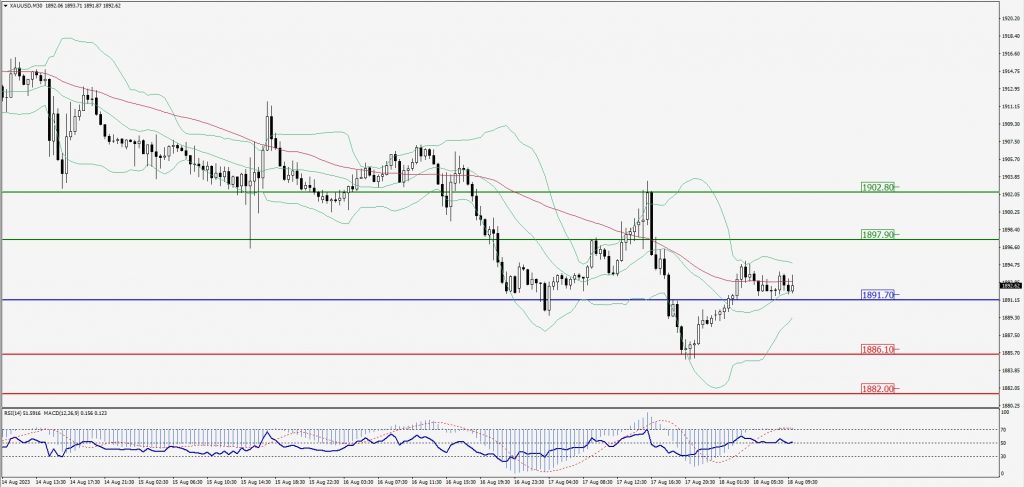
XAU/USD Intraday: Support level at 1891.70
Our pivot point is 1891.70
Preferable Price Action: Further upside to 1897.90 and 1902.80.
Alternative Price Action: If the price gives a downside breakout of a pivot, then the price extends to 1886.10 and 1882.00.
Comment: MACD is above 50 level.
Green Lines Indicate Resistance Levels – Red Lines Indicate Support Levels
Light Blue is a Pivot Point – Black represents the price when the report was produced
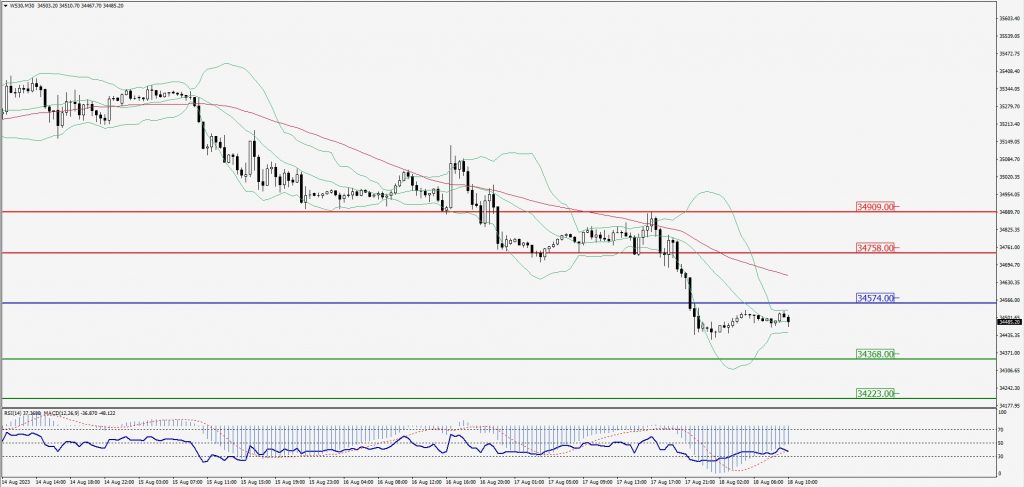
Dow Jones Intraday: Trend on the downside
Our pivot point is 34,574.00
Preferable Price Action: Take sell positions above the pivot with targets at 34,368.00 & 34,223.00.
Alternative Price Action: Above 34,574.00 looks for further upside to 34,758.00 & 34,909.00.
Comment: RSI is below 50 levels and Pairs below 55MA.
Green Lines Indicate Resistance Levels – Red Lines Indicate Support Levels
Light Blue is a Pivot Point – Black represents the price when the report was produced