Market Wrap: Stocks, Bonds, Commodities
Stock futures gained slightly in overnight trading Sunday as the market is poised to wrap up trades for July with strong gains.
The Dow Jones Industrial Average rose 176.57 points to 35,459.29, the S&P 500 gain 0.99% to 4,582.23 and the Nasdaq Composite add 266.55 points to 14,316.66.
MSCI’s index of Asia-Pacific stocks outside Japan is ascend 0.33% to 665.54 levels. The Australian index was higher by 0.09% to 7,410.40. Japanese Nikkei Index ascend 1.37% today.
European stocks were mixed on Monday, with the Stoxx Europe 50 Index rose 0.36% to 4,483.65, Germany’s DAX advance 0.16% to 16,494.05, and France’s CAC ascend 0.48% to 7,512.39 and U.K.’s FTSE 100 subtract 0.06% to 7,689.49.
Benchmark 10-year U.S. Treasury fell as demand for safe assets ascend again, today 10-year bond yields positive 0.43% to 3.9820.
Oil prices were steady on Friday, but on track for a fifth straight week of gains with investors optimistic healthy demand and supply cuts will keep prices buoyant.
Spot Brent crude oil ascend 0.30% to $84.67 per barrel. US West Texas Intermediate crude is up 0.43% to $80.93 a barrel.
The yellow metal gold is decline 0.28% to 1,994.25 dollars per ounce.
Market Wrap: Forex
The U.S. dollar edged higher in early European trade Monday, but is on course for a monthly loss as traders weigh up the possibility of an end to the Federal Reserve’s tightening cycle, while the Japanese yen weakened in the wake of the Bank of Japan’s monetary policy shift.
Today, the U.S. dollar index measures the Greenback against a trade-weighted basket of six major currencies, which surged 0.05% to 101.440.
The Euro US Dollar (EUR/USD) is a widely traded pair that is up 0.18% today. This left the pair trading around $1.10350.
The Japanese yen was negative against the U.S. dollar on Monday. Today USD/JPY is surged 0.82% to the 142.310 level.
Another commodity-related currency positive against the U.S dollar, AUD/USD rose 0.75% to 0.66990, and NZD/USD surged 0.52% to 0.61970 level.
EUR/USD Intraday: Support level at 1.10200
Our pivot point is at 1.10200
Preferable Price Action: Take buy positions above pivot level with targets at 1.10690 & 1.11000 in extension.
Alternative Price Action: Below pivot looks for a further downside to 1.09660 & 1.09270.
Comment: RSI is above 50 levels and Pairs above its 20MA & 55MA.
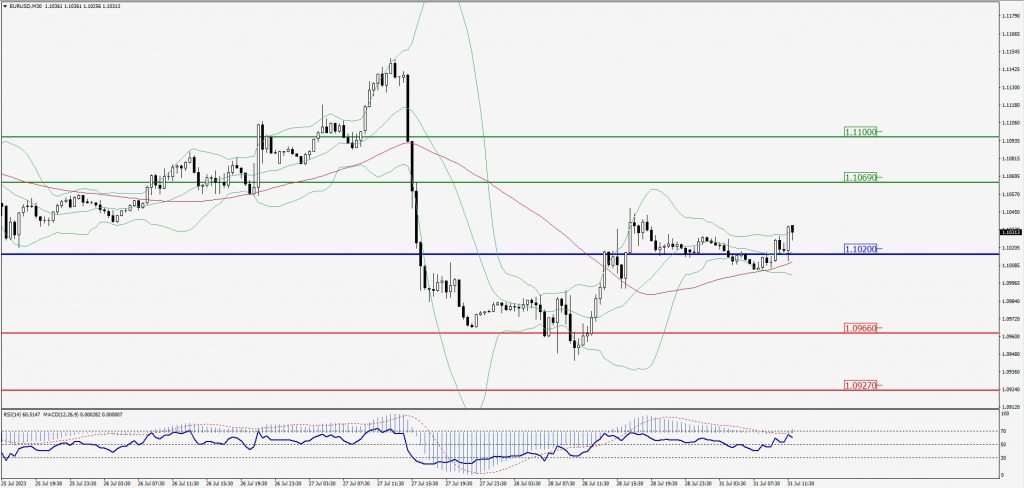
Green Lines Indicate Resistance Levels – Red Lines Indicate Support Levels
Light Blue is a Pivot Point – Black represents the price when the report was produced
GBP/USD Intraday: In a consolidation zone
Our pivot point is at 1.28410
Preferable Price Action: Buy positions above pivot with targets at 1.29140 & 1.29700 in extension.
Alternative Price Action: The price below pivot would call for further downside to 1.29140 & 1.29700.
Comment: RSI is at 50 levels and Pairs above 55MA.
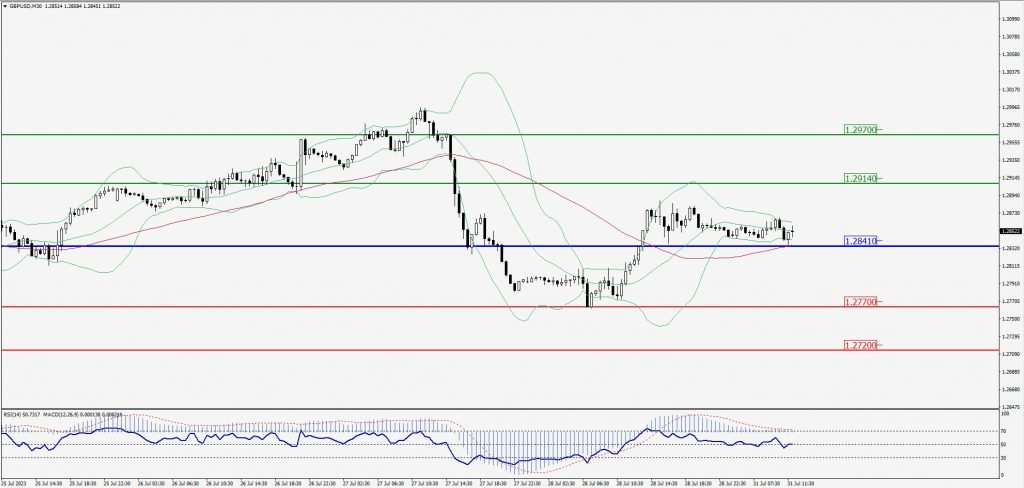
Green Lines Indicate Resistance Levels – Red Lines Indicate Support Levels
Light Blue is a Pivot Point – Black represents the price when the report was produced
USD/JPY Intraday: Major trend on the upside
Our pivot point is at 142.010
Preferable Price Action: Buy position above pivot with the target at 143.360 and 144.270 in extension.
Alternative Price Action: The downside breakout of the pivot would call for 140.700 and 139.800.
Comment: MACD is above 50 level and Pairs above its 20MA & 55MA.
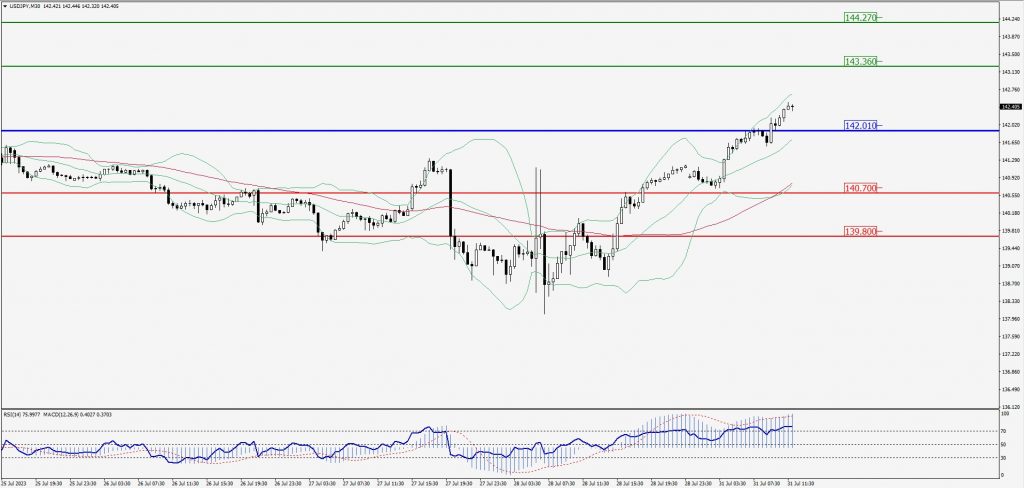
Green Lines Indicate Resistance Levels – Red Lines Indicate Support Levels
Light Blue is a Pivot Point – Black represents the price when the report was produced
AUD/USD Intraday: Trend on the upside
Our pivot point is at 0.66860
Preferable Price Action: Buy positions above pivot with targets at 0.67270 & 0.67540 in extension.
Alternative Price Action: Below pivot looks for a further downside with 0.66460 & 0.66150 as targets.
Comment: RSI is above 50 levels and Pairs above its 20AM & 55MA.
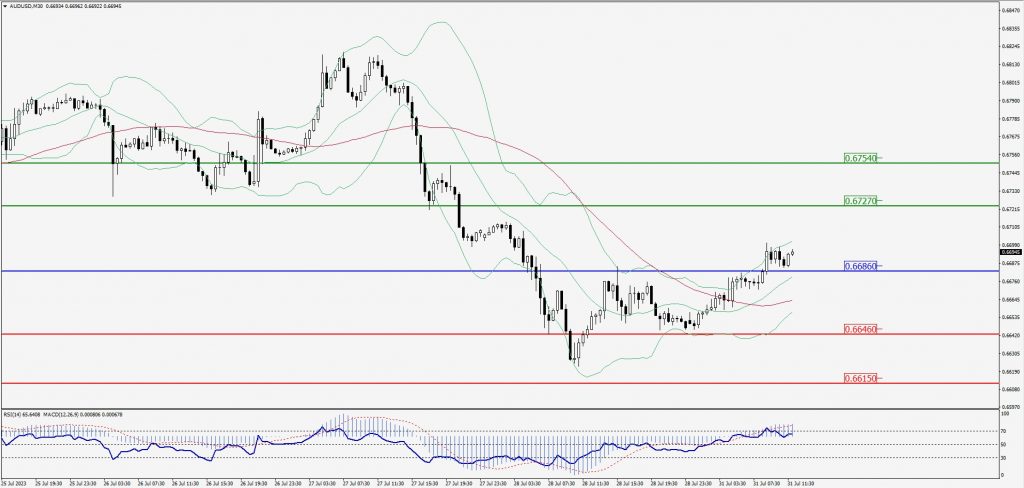
Green Lines Indicate Resistance Levels – Red Lines Indicate Support Levels
Light Blue is a Pivot Point – Black represents the price when the report was produced
CRUDEOIL Intraday: Resistance level at 80.64
Our pivot point is at 80.64
Preferable Price Action: Above pivot buy oil with 81.21 & 81.59 as targets.
Alternative Price Action: Sell crude below pivot with targets at 80.12 and 79.76 in extension.
Comment: MACD is positive territory and Pairs above its 20MA & 55MA.
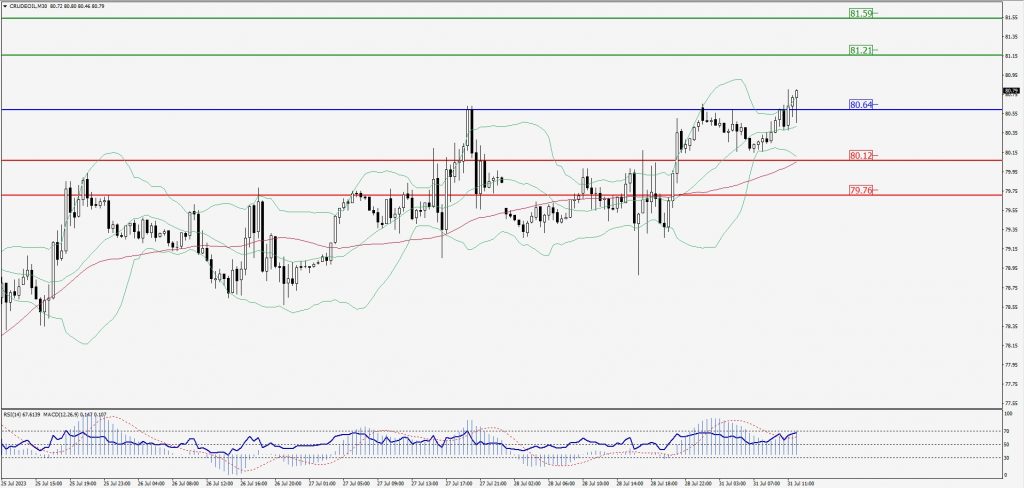
Green Lines Indicate Resistance Levels – Red Lines Indicate Support Levels
Light Blue is a Pivot Point – Black represents the price when the report was produced
XAU/USD Intraday: Trend on the downside
Our pivot point is 1958.00
Preferable Price Action: Further downside to 1948.90 and 1943.20.
Alternative Price Action: If the price gives an upside breakout of a pivot, then the price extends to 1965.50 and 1971.40.
Comment: MACD is below 50 level and Pairs below its 20MA & 55MA.
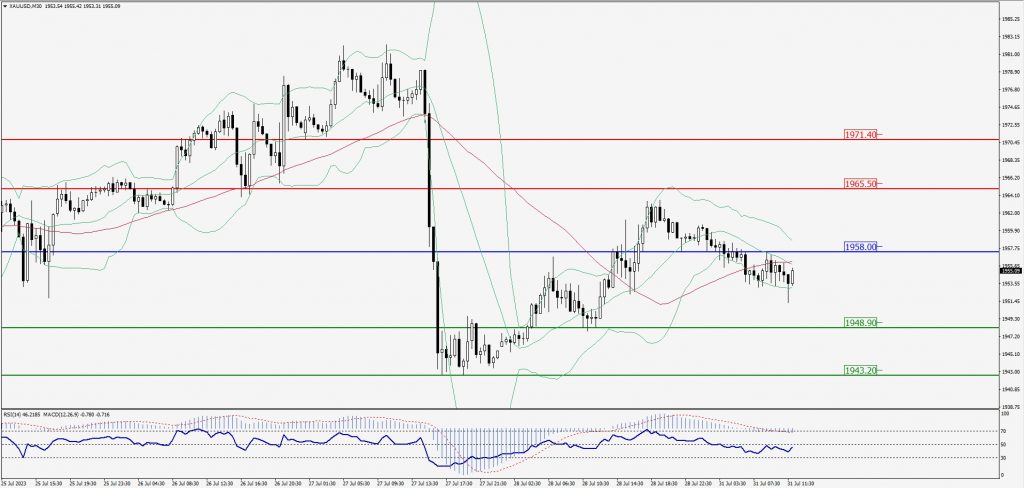
Green Lines Indicate Resistance Levels – Red Lines Indicate Support Levels
Light Blue is a Pivot Point – Black represents the price when the report was produced
Dow Jones Intraday: Trend on the upside
Our pivot point is 35,467.00
Preferable Price Action: Take buy positions above the pivot with targets at 35,547.00 & 35,609.00.
Alternative Price Action: Below 35,467.00 looks for further downside to 35,387.00 & 35,323.00.
Comment: RSI is above 50 levels and Pairs above its 20MA & 55MA.
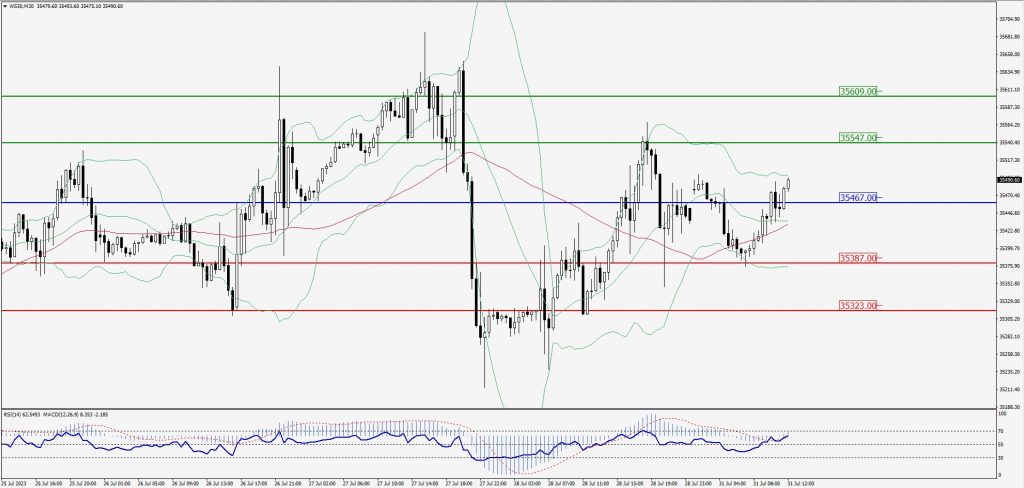
Green Lines Indicate Resistance Levels – Red Lines Indicate Support Levels
Light Blue is a Pivot Point – Black represents the price when the report was produced