Market Wrap: Stocks, Bonds, Commodities
The S&P 500 and Nasdaq fell on Thursday, weighed down by drops in Tesla and Netflix following their quarterly results, but the Dow advanced for a ninth straight day thanks to gains in Johnson & Johnson following a strong annual forecast.
The Dow Jones Industrial Average rose 163.97 points to 35,225.18, the S&P 500 lose 0.68% to 4,534.87 and the Nasdaq Composite subtract 294.71 points to 14,063.31.
MSCI’s index of Asia-Pacific stocks outside Japan is decline 0.43% to 644.10 levels. The Australian index was lower by 0.15% to 7,313.90. Japanese Nikkei Index decline 0.46% today.
European stocks were mixed on Friday, with the Stoxx Europe 50 Index fell 0.14% to 4,367.05, Germany’s DAX decline 0.40% to 16,138.15, and France’s CAC ascend 0.19% to 7,397.84 and U.K.’s FTSE 100 add 0.08% to 7,652.84.
Benchmark 10-year U.S. Treasury fell as demand for safe assets ascend again, today 10-year bond yields positive 0.16% to 3.8500.
Brent oil prices were little changed on Friday and were set to close flat for the week after three straight weeks of gains, as markets weigh lower U.S. crude inventories and tapering interest rate hikes against weak Chinese economic data that could cap demand.
Spot Brent crude oil ascend 0.98% to $80.42 per barrel. US West Texas Intermediate crude is up 1.04% to $76.44 a barrel.
The yellow metal gold is advance 0.04% to 1,971.75 dollars per ounce.
Market Wrap: Forex
The dollar was steady on Friday as data pointed to U.S. labour market resilience that could lead the Federal Reserve to keep interest rates higher for longer, while the yen wobbled after Japan’s core consumer inflation re-accelerated in June.
Today, the U.S. dollar index measures the Greenback against a trade-weighted basket of six major currencies, which surged 0.08% to 99.900.
The Euro US Dollar (EUR/USD) is a widely traded pair that is up 0.04% today. This left the pair trading around $1.11310.
The Japanese yen was negative against the U.S. dollar on Friday. Today USD/JPY is surged 1.29% to the 141.880 level.
Another commodity-related currency negative against the U.S dollar, AUD/USD fell 0.47% to 0.67480, and NZD/USD slipped 0.69% to 0.61930 level.
EUR/USD Intraday: Trend on the downside
Our pivot point is at 1.11520
Preferable Price Action: Take sell positions below pivot level with targets at 1.11180 & 1.10970 in extension.
Alternative Price Action: Above pivot looks for a further upside to 1.11800 & 1.12040.
Comment: RSI is below 50 levels and Pairs below 55MA.
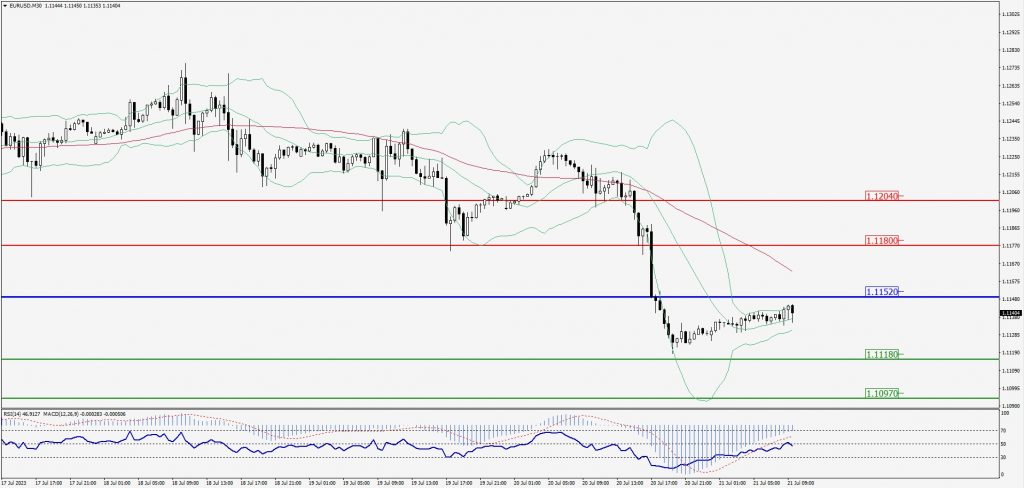
Green Lines Indicate Resistance Levels – Red Lines Indicate Support Levels
Light Blue is a Pivot Point – Black represents the price when the report was produced
GBP/USD Intraday: Support level at 1.28770
Our pivot point is at 1.28770
Preferable Price Action: Buy positions above pivot with targets at 1.29320 & 1.29700 in extension.
Alternative Price Action: The price below pivot would call for further downside to 1.28280 & 1.27920.
Comment: RSI is above 50 levels and Pairs above its 20MA & 55MA.
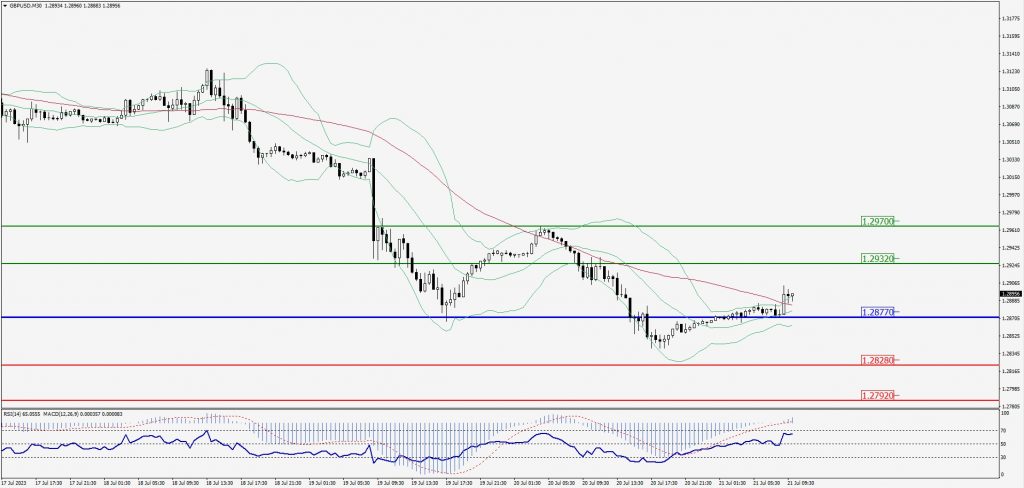
Green Lines Indicate Resistance Levels – Red Lines Indicate Support Levels
Light Blue is a Pivot Point – Black represents the price when the report was produced
USD/JPY Intraday: Trend on the upside
Our pivot point is at 140.100
Preferable Price Action: Buy position above pivot with the target at 140.800 and 141.200 in extension.
Alternative Price Action: The downside breakout of the pivot would call for 139.500 and 139.100.
Comment: MACD is above 50 level and Pairs above its 20MA & 55MA.
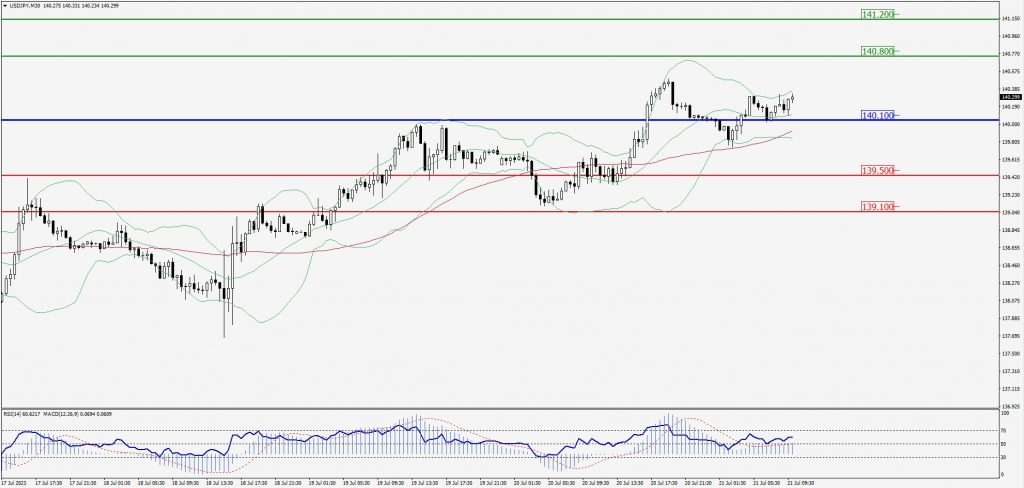
Green Lines Indicate Resistance Levels – Red Lines Indicate Support Levels
Light Blue is a Pivot Point – Black represents the price when the report was produced
AUD/USD Intraday: Trend on the upside
Our pivot point is at 0.67770
Preferable Price Action: Buy positions above pivot with targets at 0.67990 & 0.68150 in extension.
Alternative Price Action: Below pivot looks for a further downside with 0.67580 & 0.67450 as targets.
Comment: RSI is above 50 levels and Pairs above 20MA.
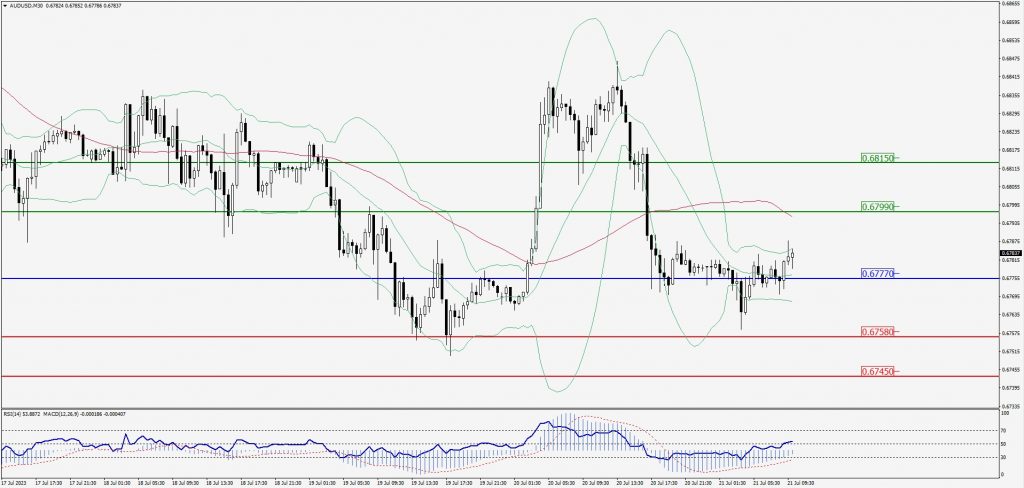
Green Lines Indicate Resistance Levels – Red Lines Indicate Support Levels
Light Blue is a Pivot Point – Black represents the price when the report was produced
CRUDEOIL Intraday: Trend on the upside
Our pivot point is at 76.09
Preferable Price Action: Above pivot buy oil with 76.89 & 77.41 as targets.
Alternative Price Action:Sell crude below pivot with targets at 75.35 and 74.84 in extension.
Comment: MACD is positive territory and Pairs above its 20MA & 55MA.
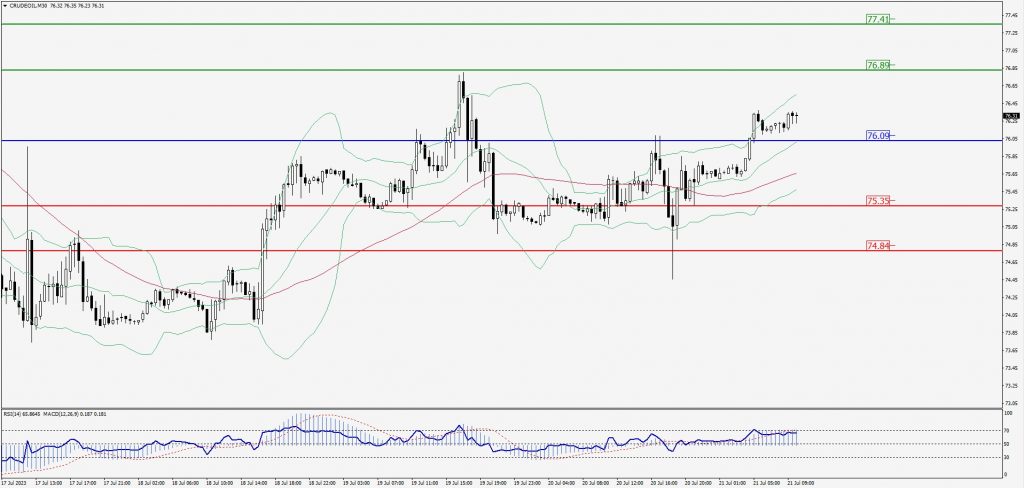
Green Lines Indicate Resistance Levels – Red Lines Indicate Support Levels
Light Blue is a Pivot Point – Black represents the price when the report was produced
XAU/USD Intraday: Trend on the downside
Our pivot point is 1974.40
Preferable Price Action: Further downside to 1964.30 and 1958.50.
Alternative Price Action: If the price gives an upside breakout of a pivot, then the price extends to 1982.60 and 1988.70.
Comment: MACD is below 50 level and Pairs below 55MA.
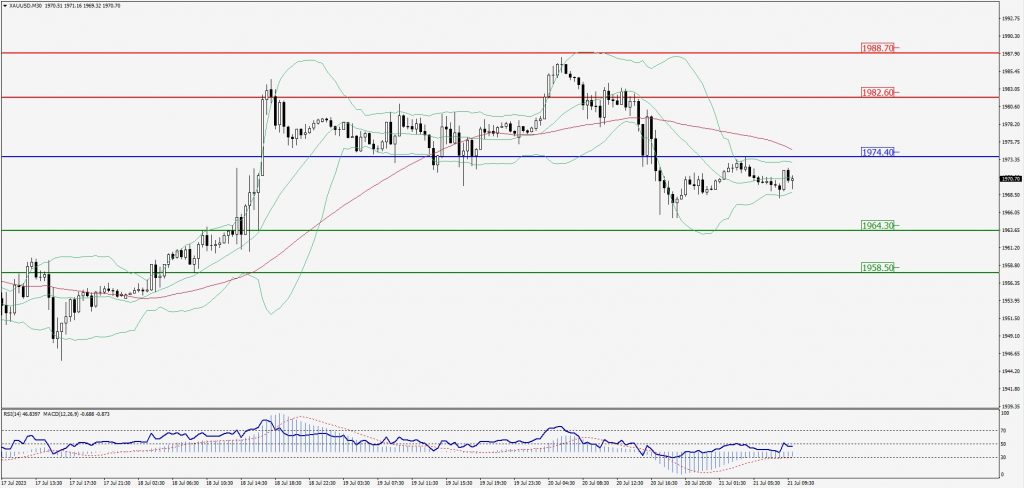
Green Lines Indicate Resistance Levels – Red Lines Indicate Support Levels
Light Blue is a Pivot Point – Black represents the price when the report was produced
Dow Jones Intraday: Trend on the upside
Our pivot point is 35,193.00
Preferable Price Action: Take buy positions above the pivot with targets at 35,414.00 & 35,562.00.
Alternative Price Action: Below 35,193.00 looks for further downside to 35,012.00 & 34,866.00.
Comment: RSI is above 50 levels and Pairs above its 20MA & 55MA.
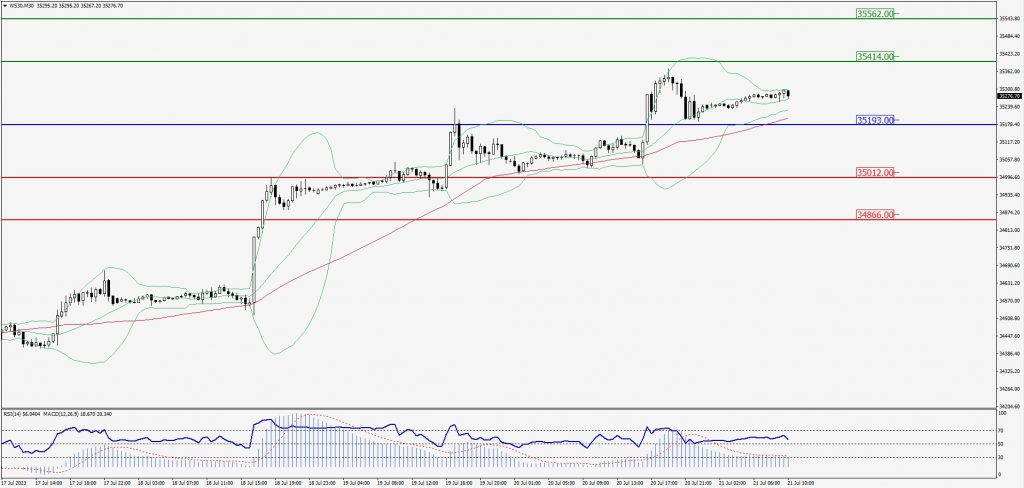
Green Lines Indicate Resistance Levels – Red Lines Indicate Support Levels
Light Blue is a Pivot Point – Black represents the price when the report was produced