Market Wrap: Stocks, Bonds, Commodities
US stocks ended higher on Monday following last week’s losses, while Federal Reserve officials’ comments bolstered the view that the U.S. central bank may be near the end of its tightening cycle.
The Dow Jones Industrial Average rose 209.52 points to 33,944.40, the S&P 500 gain 0.24% to 4,409.53 and the Nasdaq Composite add 24.76 points to 13,685.48.
MSCI’s index of Asia-Pacific stocks outside Japan is advance 1.51% to 633.08 levels. The Australian index was higher by 1.50% to 7,108.90. Japanese Nikkei Index advance 0.04% today.
European stocks were positive on Tuesday, with the Stoxx Europe 50 Index rose 0.13% to 4,261.85, Germany’s DAX advance 0.01% to 15,672.75, and France’s CAC ascend 0.45% to 7,175.04 and U.K.’s FTSE 100 subtract 0.32% to 7,250.72.
Benchmark 10-year U.S. Treasury fell as demand for safe assets ascend again, today 10-year bond yields negative 0.85% to 3.9720.
Oil prices edged higher on Tuesday, recouping some of the losses from the previous session, as traders focused on supply cuts by the world’s biggest oil exporters Saudi Arabia and Russia and awaited data that could help ascertain demand.
Spot Brent crude oil ascend 0.80% to $78.31 per barrel. US West Texas Intermediate crude is up 0.90% to $73.64 a barrel.
The yellow metal gold is advance 0.54% to 1,941.55 dollars per ounce.
Market Wrap: Forex
The dollar weakened on Tuesday after Federal Reserve officials signalled that the central bank was nearing the end of its tightening cycle, though it traded in a tight range ahead of a key U.S. inflation report.
Today, the U.S. dollar index measures the Greenback against a trade-weighted basket of six major currencies, which slipped 0.20% to 101.440.
The Euro US Dollar (EUR/USD) is a widely traded pair that is up 0.09% today. This left the pair trading around $1.10090.
The Japanese yen was negative against the U.S. dollar on Tuesday. Today USD/JPY is slipped 0.53% to the 140.570 level.
Another commodity-related currency negative against the U.S dollar, AUD/USD fell 0.10% to 0.66680, and NZD/USD slipped 0.35% to 0.61860 level.
EUR/USD Intraday: Trend on the upside
Our pivot point is at 1.10050
Preferable Price Action: Take buy positions above pivot level with targets at 1.10480 & 1.10760 in extension.
Alternative Price Action: Below pivot looks for a further downside to 1.09640 & 1.09370.
Comment: RSI is above 50 levels and Pairs above its 20MA & 55MA.
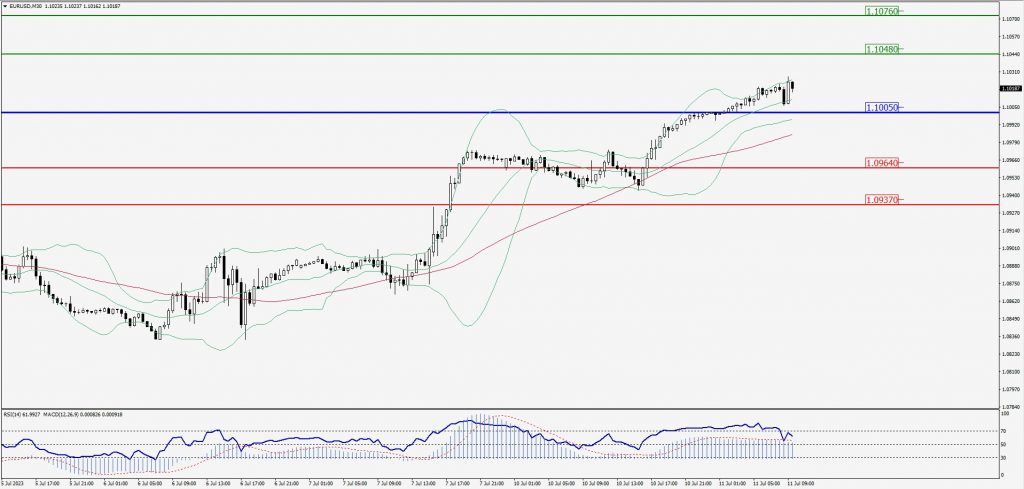
Green Lines Indicate Resistance Levels – Red Lines Indicate Support Levels
Light Blue is a Pivot Point – Black represents the price when the report was produced
GBP/USD Intraday: Major trend on the upside
Our pivot point is at 1.28750
Preferable Price Action: Buy positions above pivot with targets at 1.29390 & 1.29830 in extension.
Alternative Price Action: The price below pivot would call for further downside to 1.28240 & 1.27810.
Comment: RSI is above 50 levels and Pairs above its 20MA & 55MA.
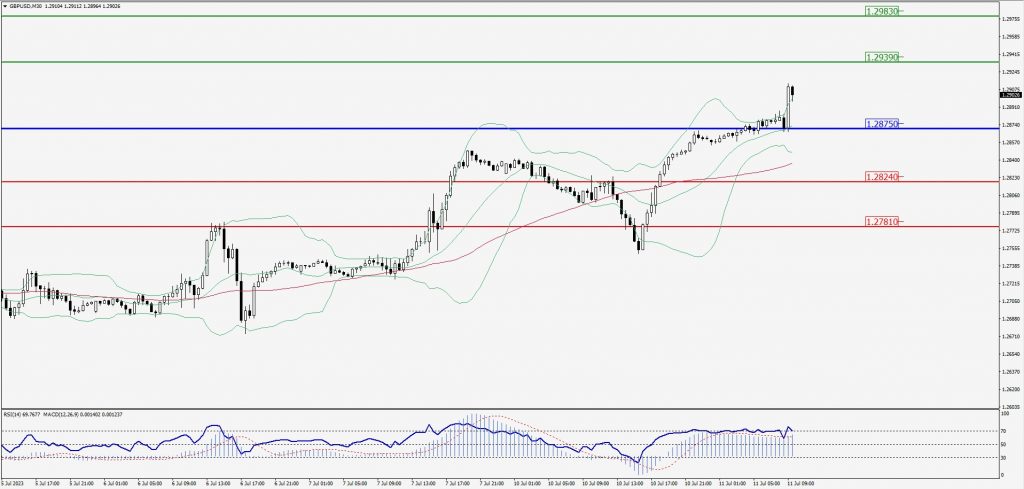
Green Lines Indicate Resistance Levels – Red Lines Indicate Support Levels
Light Blue is a Pivot Point – Black represents the price when the report was produced
USD/JPY Intraday: Major trend on the downside
Our pivot point is at 141.160
Preferable Price Action: Sell position below pivot with the target at 140.160 and 139.540 in extension.
Alternative Price Action: The upside breakout of the pivot would call for 142.010 and 142.680.
Comment: MACD is below 50 level and Pairs below its 20MA & 55MA.
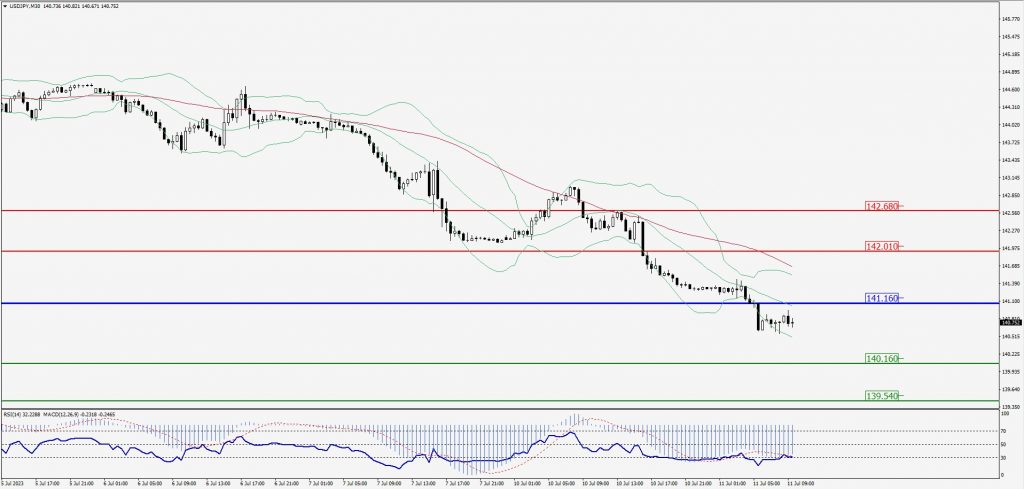
Green Lines Indicate Resistance Levels – Red Lines Indicate Support Levels
Light Blue is a Pivot Point – Black represents the price when the report was produced
AUD/USD Intraday: Support level at 0.66790
Our pivot point is at 0.66790
Preferable Price Action: Buy positions above pivot with targets at 0.67040 & 0.67210 in extension.
Alternative Price Action: Below pivot looks for a further downside with 0.66560 & 0.66400 as targets.
Comment: RSI is above 50 levels and Pairs above its 20MA & 55MA.
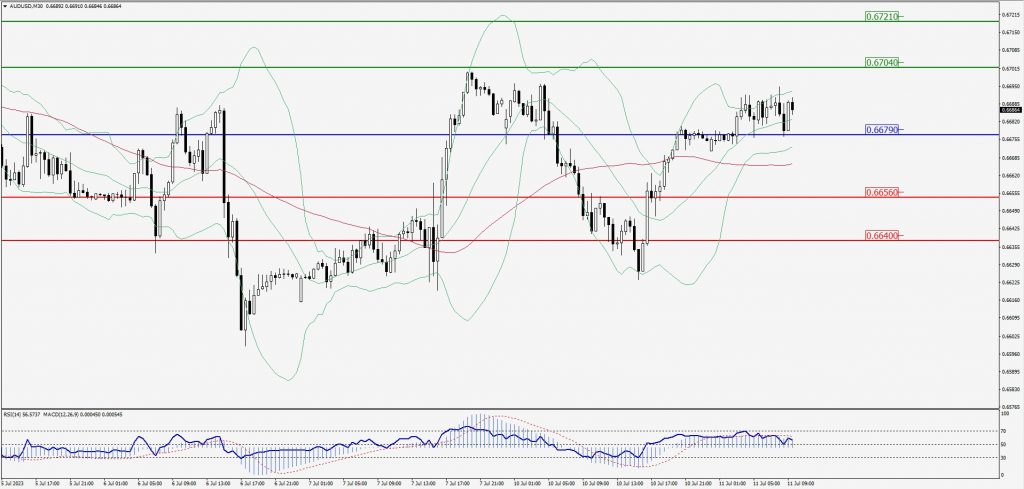
Green Lines Indicate Resistance Levels – Red Lines Indicate Support Levels
Light Blue is a Pivot Point – Black represents the price when the report was produced
CRUDEOIL Intraday: In a consolidation zone
Our pivot point is at 72.98
Preferable Price Action: Above pivot buy oil with 74.04 & 74.82 as targets.
Alternative Price Action: Sell crude below pivot with targets at 72.04 and 71.42 in extension.
Comment: MACD is flat territory.
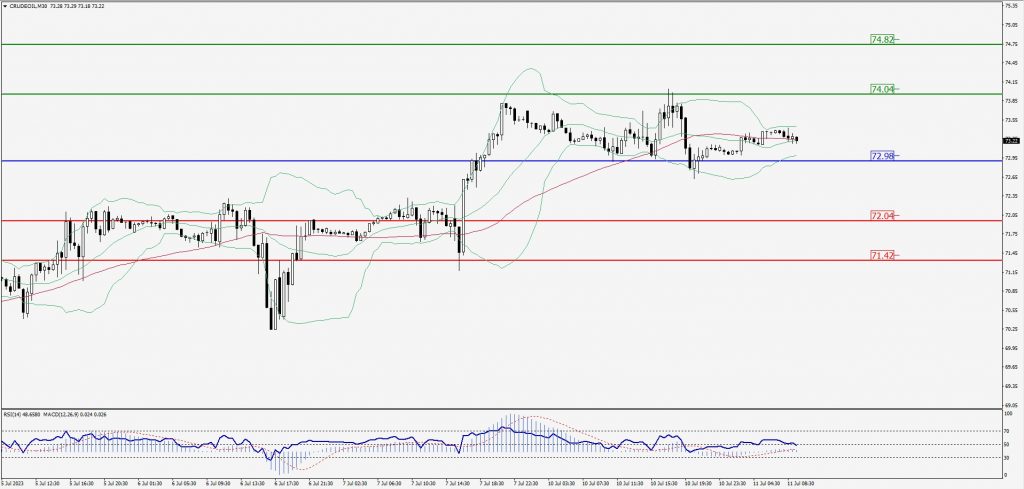
Green Lines Indicate Resistance Levels – Red Lines Indicate Support Levels
Light Blue is a Pivot Point – Black represents the price when the report was produced
XAU/USD Intraday: Major trend on the upside
Our pivot point is 1934.00
Preferable Price Action: Further upside to 1941.80 and 1947.40.
Alternative Price Action: If the price gives a downside breakout of a pivot, then the price extends to 1927.50 and 1922.20.
Comment: MACD is above 50 level and Pairs above its 20MA & 55MA.
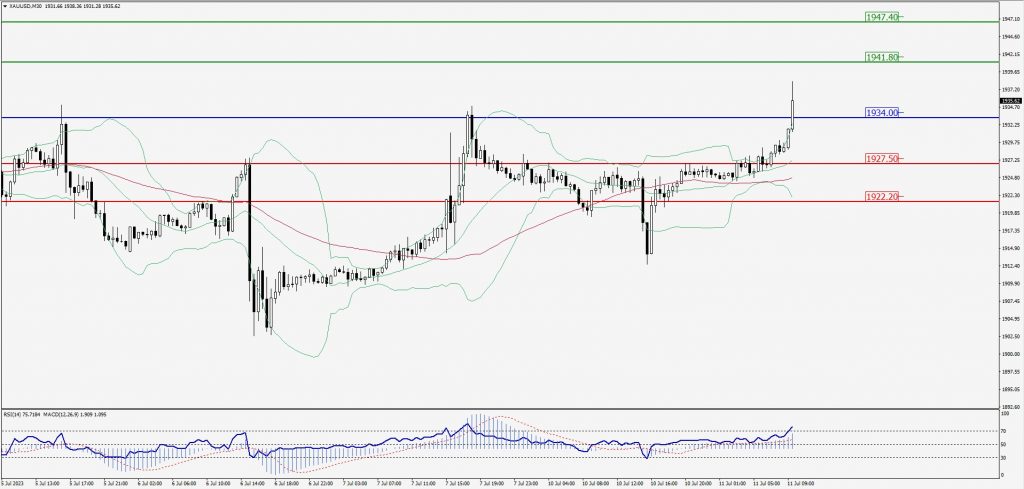
Green Lines Indicate Resistance Levels – Red Lines Indicate Support Levels
Light Blue is a Pivot Point – Black represents the price when the report was produced
Dow Jones Intraday: Support level at 33,960.00
Our pivot point is 33,960.00
Preferable Price Action: Take buy positions above the pivot with targets at 34,113.00 & 34,221.00.
Alternative Price Action: Below 33,960.00 looks for further downside to 33,820.00 & 33,717.00.
Comment: RSI is above 50 levels and Pairs above its 20MA & 55MA.
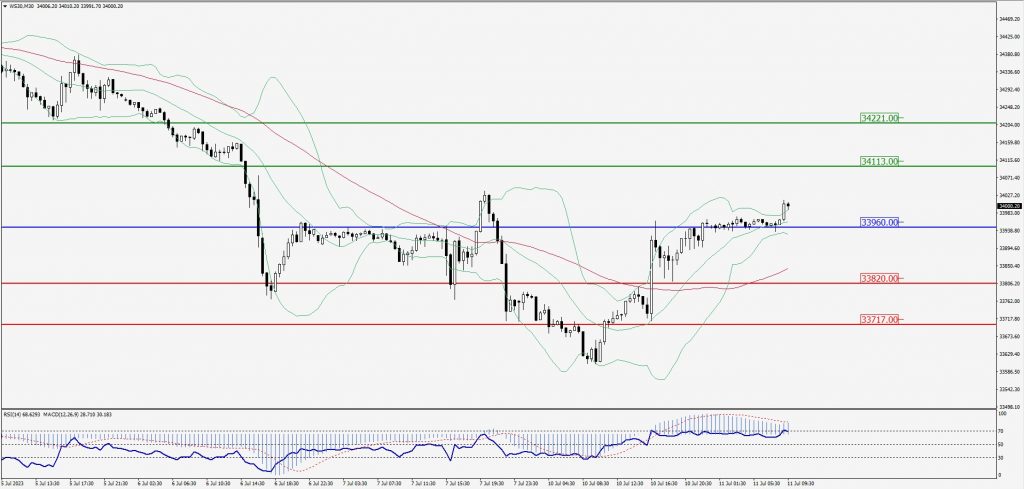
Green Lines Indicate Resistance Levels – Red Lines Indicate Support Levels
Light Blue is a Pivot Point – Black represents the price when the report was produced