Market Wrap: Stocks, Bonds, Commodities
Australia’s corporate regulator on Wednesday asked the country’s banks to disclose data on fees charged to Indigenous consumers after a review found they were not meeting targets for moving First Nations people into low-fee accounts.
The Dow Jones Industrial Average rose 10.87 points to 34,418.47, the S&P 500 gain 0.12% to 4,455.59 and the Nasdaq Composite add 28.85 points to 13,816.77.
MSCI’s index of Asia-Pacific stocks outside Japan is decline 0.81% to 637.79 levels. The Australian index was lower by 0.35% to 7,253.20. Japanese Nikkei Index decline 0.25% today.
European stocks were negative on Wednesday, with the Stoxx Europe 50 Index fell 0.50% to 4,368.95, Germany’s DAX decline 0.46% to 15,963.95, and France’s CAC drop 0.44% to 7,337.71 and U.K.’s FTSE 100 subtract 0.50% to 7,482.38.
Benchmark 10-year U.S. Treasury fell as demand for safe assets ascend again, today 10-year bond yields negative 0.10% to 3.8540.
Oil prices eased on Wednesday, paring the previous day’s gain as fears over a global economic slowdown denting fuel demand outweighed expectations of tighter supply due to output cuts announced by top exporters Saudi Arabia and Russia for August.
Spot Brent crude oil drop 1.13% to $75.37 per barrel. US West Texas Intermediate crude is up 0.93% to $70.42 a barrel.
The yellow metal gold is advance 0.20% to 1,933.55 dollars per ounce.
Market Wrap: Forex
The U.S. dollar drifted near the middle of its range of the past three weeks against major peers on Wednesday, as traders looked ahead to the release of minutes from the Federal Reserve’s latest meeting for clues about the path for monetary policy.
Today, the U.S. dollar index measures the Greenback against a trade-weighted basket of six major currencies, which surged 0.16% to 102.810.
The Euro US Dollar (EUR/USD) is a widely traded pair that is up 0.04% today. This left the pair trading around $1.08810.
The Japanese yen was negative against the U.S. dollar on Wednesday. Today USD/JPY is slipped 0.03% to the 144.400 level.
Another commodity-related currency negative against the U.S dollar, AUD/USD fell 0.36% to 0.66670, and NZD/USD slipped 0.08% to 0.61830 level.
EUR/USD Intraday: Trend on the upside
Our pivot point is at 1.08810
Preferable Price Action: Take buy positions above pivot level with targets at 1.09030 & 1.09190 in extension.
Alternative Price Action: Below pivot looks for a further downside to 1.08610 & 1.08470.
Comment: RSI is above 50 levels and Pairs above 20MA.
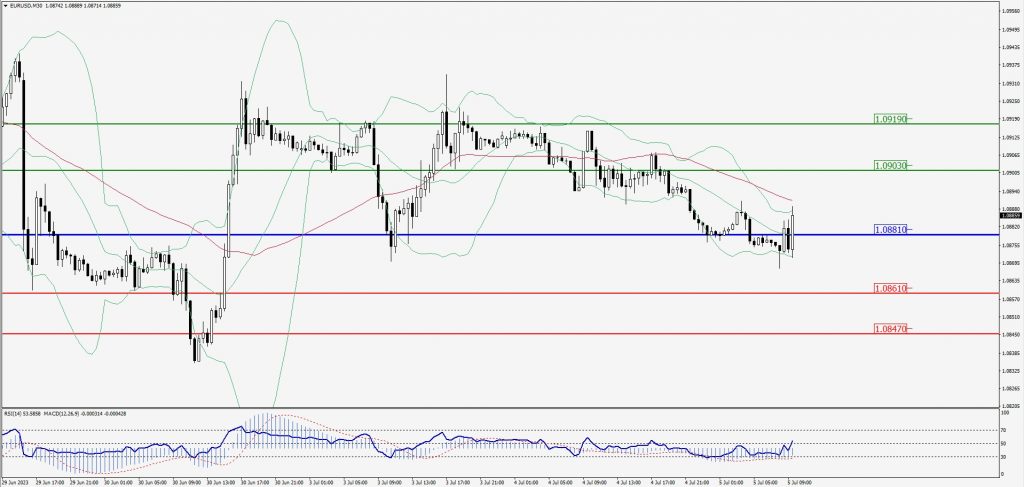
Green Lines Indicate Resistance Levels – Red Lines Indicate Support Levels
Light Blue is a Pivot Point – Black represents the price when the report was produced
GBP/USD Intraday: Trend on the downside
Our pivot point is at 1.27150
Preferable Price Action: Sell positions below pivot with targets at 1.26860 & 1.26700 in extension.
Alternative Price Action: The price above pivot would call for further upside to 1.27400 & 1.27580.
Comment: RSI is below 50 levels and Pairs below its 20MA & 55MA.
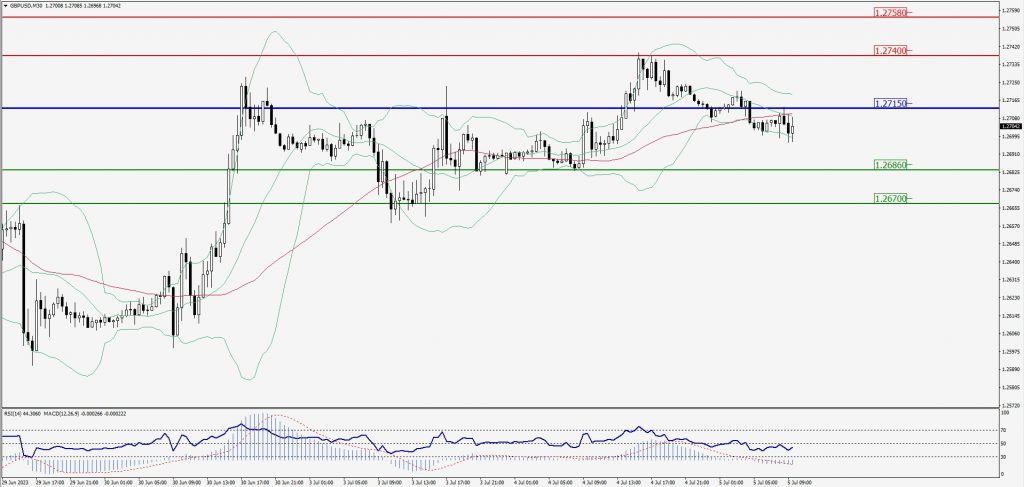
Green Lines Indicate Resistance Levels – Red Lines Indicate Support Levels
Light Blue is a Pivot Point – Black represents the price when the report was produced
USD/JPY Intraday: Support level at 144.610
Our pivot point is at 144.610
Preferable Price Action: Buy position above pivot with the target at 144.830 and 144.970 in extension.
Alternative Price Action: The downside breakout of the pivot would call for 144.450 and 144.330.
Comment: MACD is above 50 level and Pairs above its 20MA & 55MA.
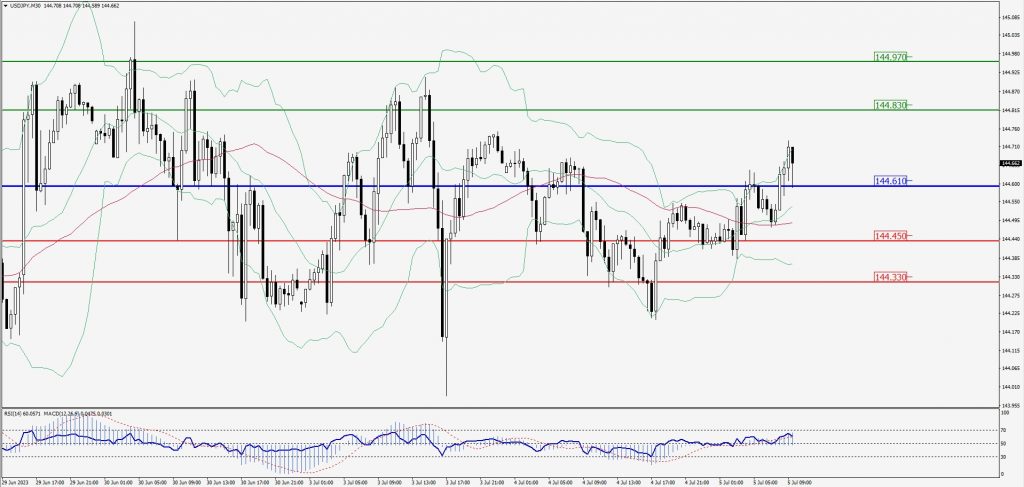
Green Lines Indicate Resistance Levels – Red Lines Indicate Support Levels
Light Blue is a Pivot Point – Black represents the price when the report was produced
AUD/USD Intraday: Resistance level at 0.66880
Our pivot point is at 0.66880
Preferable Price Action: Sell positions below pivot with targets at 0.66630 & 0.66470 in extension.
Alternative Price Action: Above pivot looks for a further upside with 0.67100 & 0.67260 as targets.
Comment: RSI is below 50 levels and Pairs below its 20MA & 55MA.
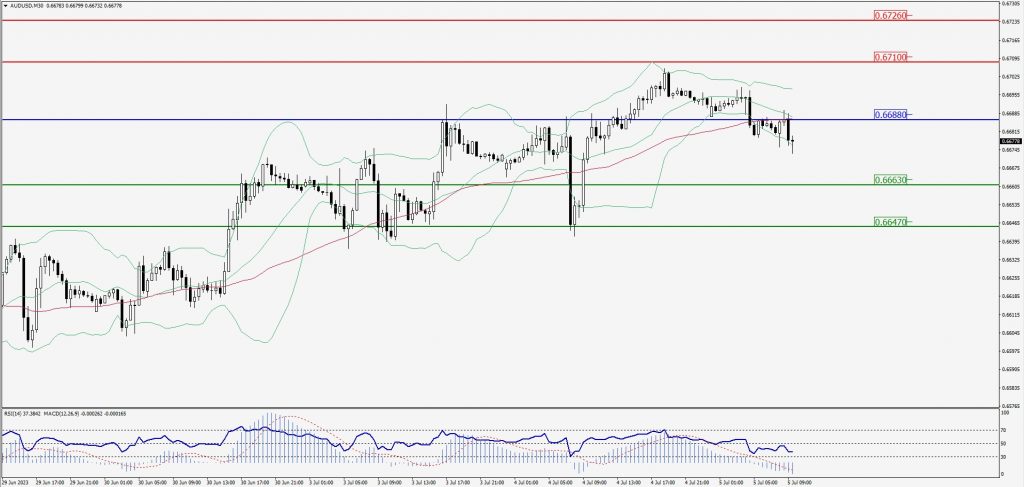
Green Lines Indicate Resistance Levels – Red Lines Indicate Support Levels
Light Blue is a Pivot Point – Black represents the price when the report was produced
CRUDEOIL Intraday: Trend on the downside
Our pivot point is at 71.25
Preferable Price Action: Below pivot Sell oil with 70.37 & 69.72 as targets.
Alternative Price Action: Buy crude above pivot with targets at 72.07 and 72.72 in extension.
Comment: MACD is negative territory and Pairs below 20MA.
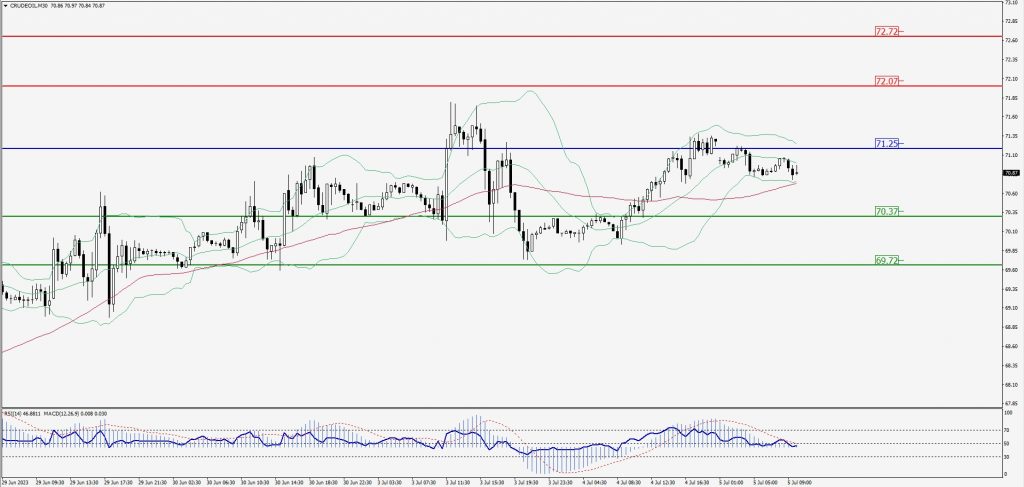
Green Lines Indicate Resistance Levels – Red Lines Indicate Support Levels
Light Blue is a Pivot Point – Black represents the price when the report was produced
XAU/USD Intraday: Major trend on the downside
Our pivot point is 1927.30
Preferable Price Action: Further downside to 1919.00 and 1913.70.
Alternative Price Action: If the price gives an upside breakout of a pivot, then the price extends to 1934.00 and 1939.20.
Comment: MACD is below 50 level and Pairs below its 20MA & 55MA.
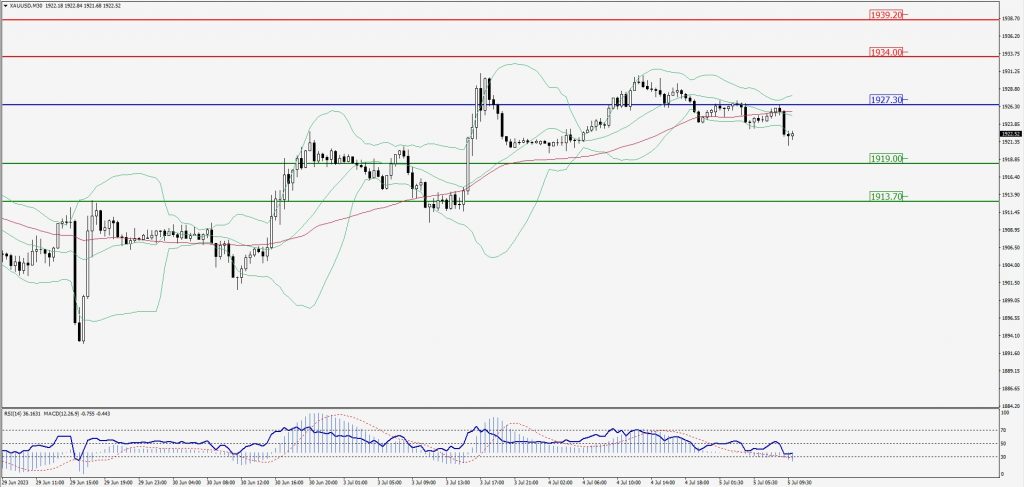
Green Lines Indicate Resistance Levels – Red Lines Indicate Support Levels
Light Blue is a Pivot Point – Black represents the price when the report was produced
Dow Jones Intraday: Major trend on the downside
Our pivot point is 34,386.00
Preferable Price Action: Take sell positions below the pivot with targets at 34,286.00 & 34,223.00.
Alternative Price Action: Above 34,386.00 looks for further downside to 34,471.00 & 34,536.00.
Comment: RSI is below 50 levels and Pairs below its 20MA & 55MA.
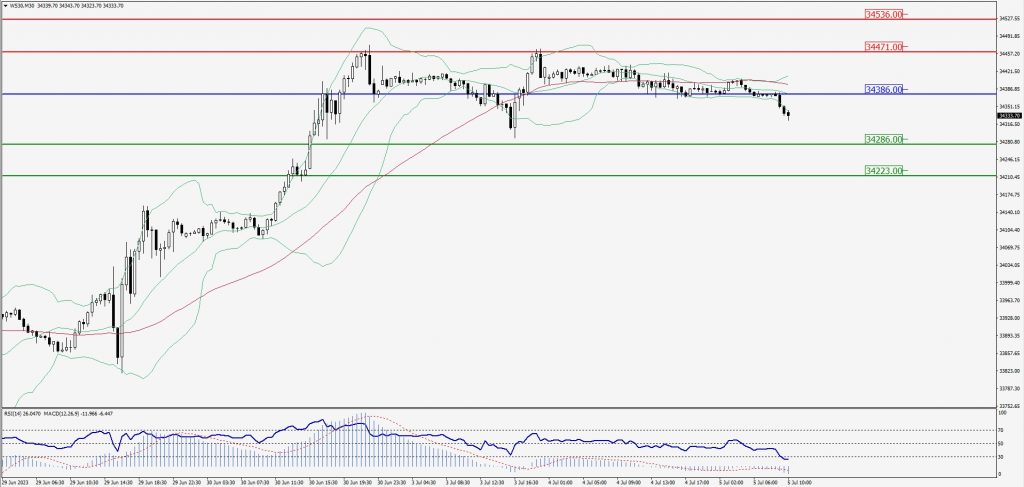
Green Lines Indicate Resistance Levels – Red Lines Indicate Support Levels
Light Blue is a Pivot Point – Black represents the price when the report was produced