Market Wrap: Stocks, Bonds, Commodities
The U.S. stock market has powered higher in the first half of this year despite numerous obstacles, from banking sector turmoil to recurring doubts about the economy’s health.
The Dow Jones Industrial Average fell 74.08 points to 33,852.66, the S&P 500 lose 0.04% to 4,376.86 and the Nasdaq Composite add 36.08 points to 13,591.75.
MSCI’s index of Asia-Pacific stocks outside Japan is decline 0.63% to 629.90 levels. The Australian index was lower by 0.02% to 7,194.90. Japanese Nikkei Index advance 0.12% today.
European stocks were mixed on Thursday, with the Stoxx Europe 50 Index rose 0.34% to 4,359.65, Germany’s DAX advance 0.01% to 15,949.16, and France’s CAC ascend 0.47% to 7,320.31 and U.K.’s FTSE 100 subtract 0.09% to 7,493.99.
Benchmark 10-year U.S. Treasury fell as demand for safe assets ascend again, today 10-year bond yields positive 1.03% to 3.7490.
Oil prices fell on Thursday, paring some of the previous day’s gains, as investors took profits on concerns of further interest rate hikes dampening economic growth and global fuel demand while weak economic data in China also weighed on sentiment.
Spot Brent crude oil ascend 0.24% to $74.44 per barrel. US West Texas Intermediate crude is up 0.40% to $69.84 a barrel.
The yellow metal gold is decline 0.43% to 1,913.85 dollars per ounce.
Market Wrap: Forex
The U.S. dollar touched a more than seven-month high against the yen on Thursday after the heads of the respective central banks reaffirmed the divergence in policy, while Sweden’s crown hit a record low after the Riksbank modestly raised its policy rate.
Today, the U.S. dollar index measures the Greenback against a trade-weighted basket of six major currencies, which surged 0.08% to 102.630.
The Euro US Dollar (EUR/USD) is a widely traded pair that is up 0.04% today. This left the pair trading around $1.09150.
The Japanese yen was negative against the U.S. dollar on Thursday. Today USD/JPY is slipped 0.15% to the 144.260 level.
Another commodity-related currency positive against the U.S dollar, AUD/USD rose 0.32% to 0.66210, and NZD/USD surged 0.10% to 0.60800 level.
EUR/USD Intraday: Trend on the downside
Our pivot point is at 1.09110
Preferable Price Action: Take sell positions below pivot level with targets at 1.08780 & 1.08570 in extension.
Alternative Price Action: Above pivot looks for a further upside to 1.09410 & 1.09620.
Comment: RSI is below 50 levels and Pairs below its 20MA & 55MA.
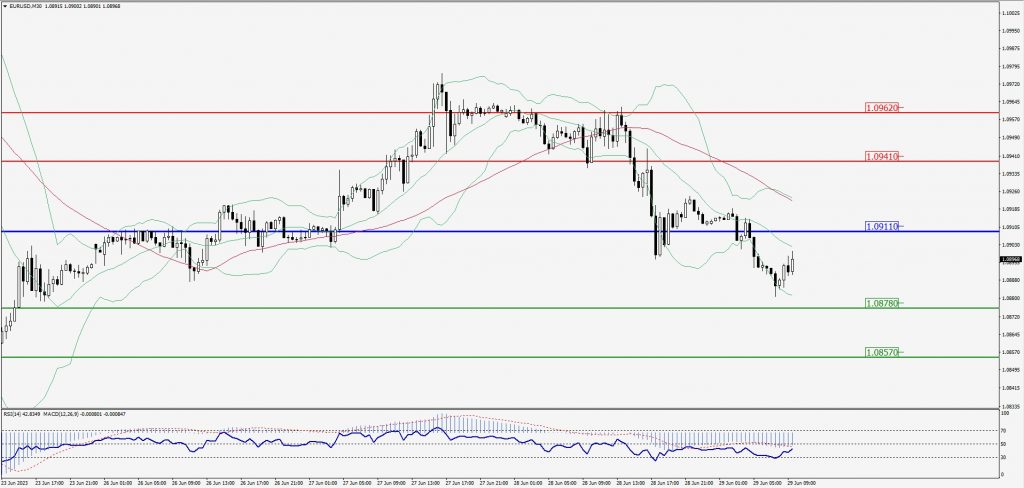
Green Lines Indicate Resistance Levels – Red Lines Indicate Support Levels
Light Blue is a Pivot Point – Black represents the price when the report was produced
GBP/USD Intraday: Resistance level at 1.26490
Our pivot point is at 1.26490
Preferable Price Action: Sell positions below pivot with targets at 1.26080 & 1.25850 in extension.
Alternative Price Action: The price above pivot would call for further upside to 1.26860 & 1.27130.
Comment: RSI is below 50 levels and Pairs below 55MA.
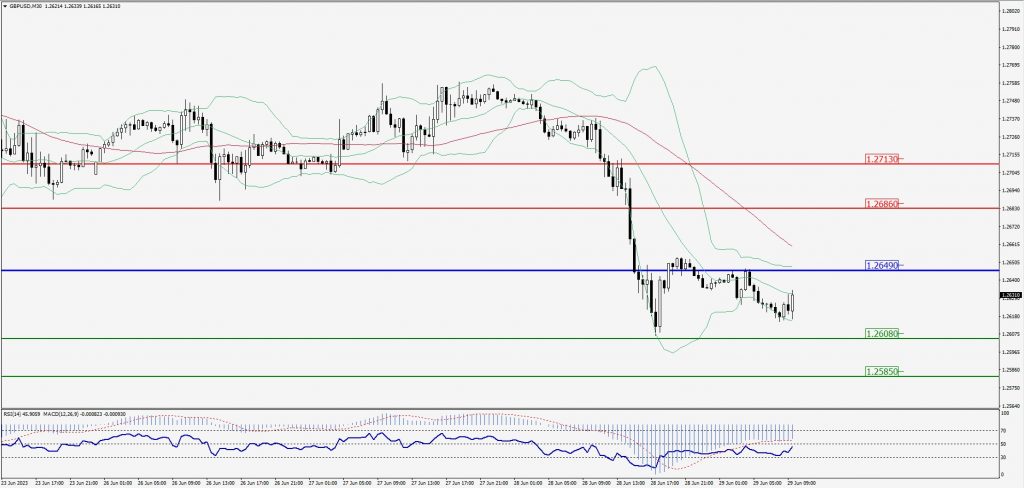
Green Lines Indicate Resistance Levels – Red Lines Indicate Support Levels
Light Blue is a Pivot Point – Black represents the price when the report was produced
USD/JPY Intraday: Major trend on the upside
Our pivot point is at 144.500
Preferable Price Action: Buy position above pivot with the target at 144.980 and 145.310 in extension.
Alternative Price Action: The downside breakout of the pivot would call for 144.060 and 143.770.
Comment: MACD is above 50 level and Pairs above its 20MA & 55MA.
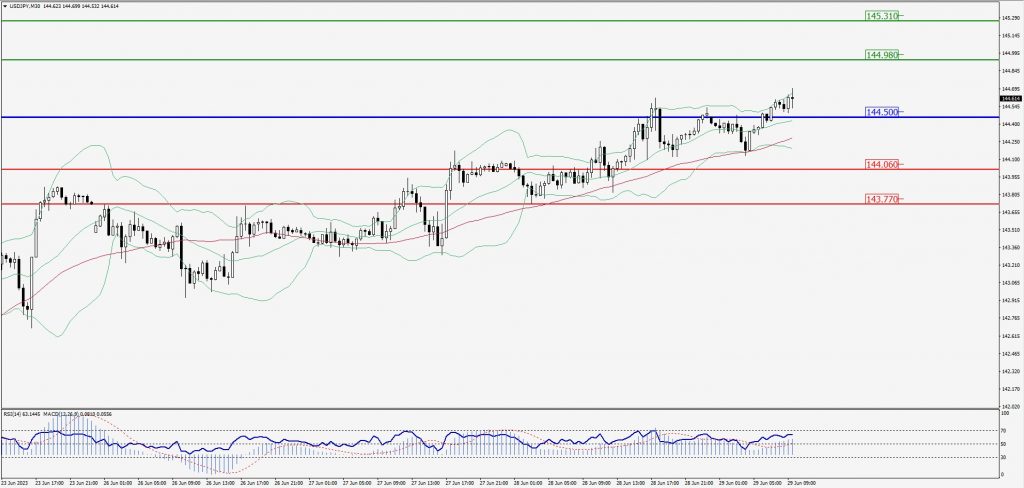
Green Lines Indicate Resistance Levels – Red Lines Indicate Support Levels
Light Blue is a Pivot Point – Black represents the price when the report was produced
AUD/USD Intraday: In a consolidation zone
Our pivot point is at 0.66250
Preferable Price Action: Sell positions below pivot with targets at 0.65950 & 0.65740 in extension.
Alternative Price Action: Above pivot looks for a further upside with 0.66490 & 0.66680 as targets.
Comment: RSI is at 50 levels and Pairs below 55MA.
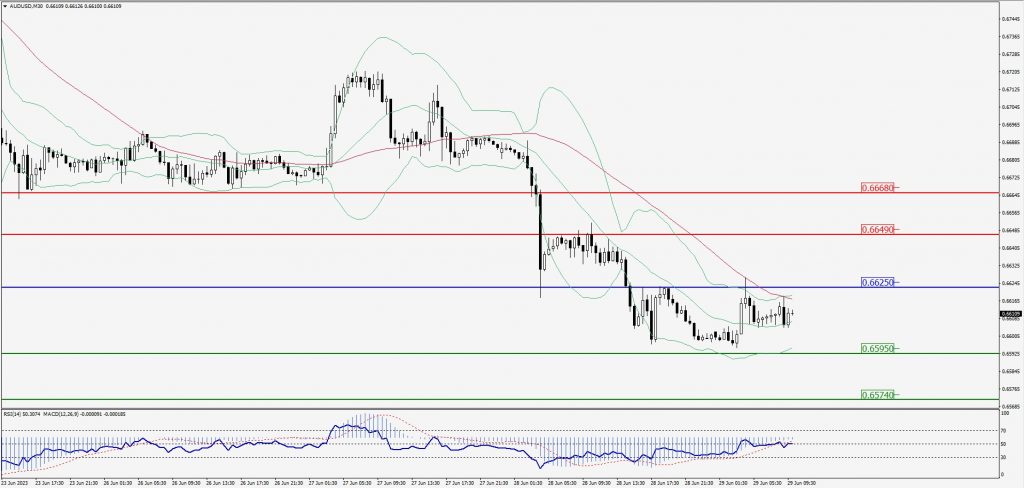
Green Lines Indicate Resistance Levels – Red Lines Indicate Support Levels
Light Blue is a Pivot Point – Black represents the price when the report was produced
CRUDEOIL Intraday: Trend on the upside
Our pivot point is at 69.21
Preferable Price Action: Above pivot buy oil with 70.01 & 70.56 as targets.
Alternative Price Action: Sell crude below pivot with targets at 68.51 and 67.96 in extension.
Comment: MACD is positive territory and Pairs above 55MA.
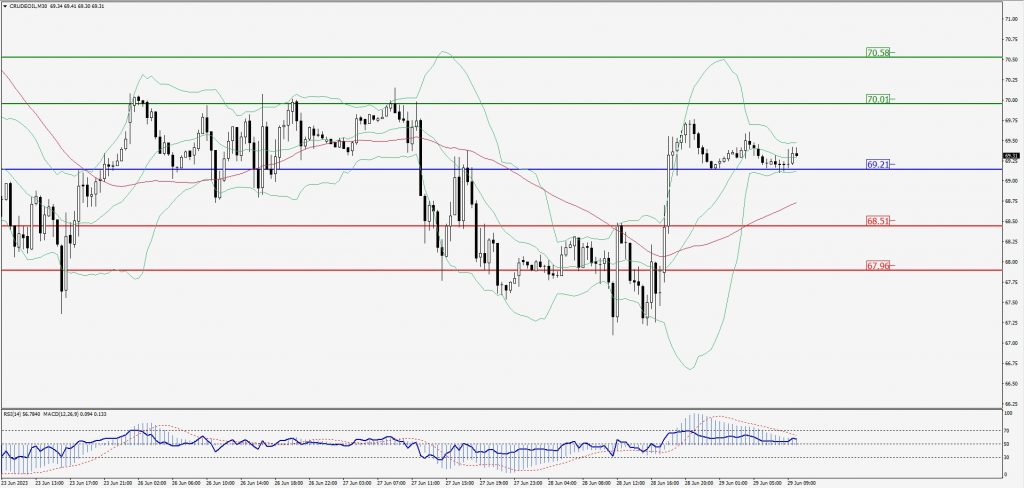
Green Lines Indicate Resistance Levels – Red Lines Indicate Support Levels
Light Blue is a Pivot Point – Black represents the price when the report was produced
XAU/USD Intraday: Trend on the downside
Our pivot point is 1906.90
Preferable Price Action: Further downside to 1896.80 and 1890.60.
Alternative Price Action: If the price gives an upside breakout of a pivot, then the price extends to 1916.30 and 1923.70.
Comment: MACD is below 50 level and Pairs below its 20MA & 55MA.
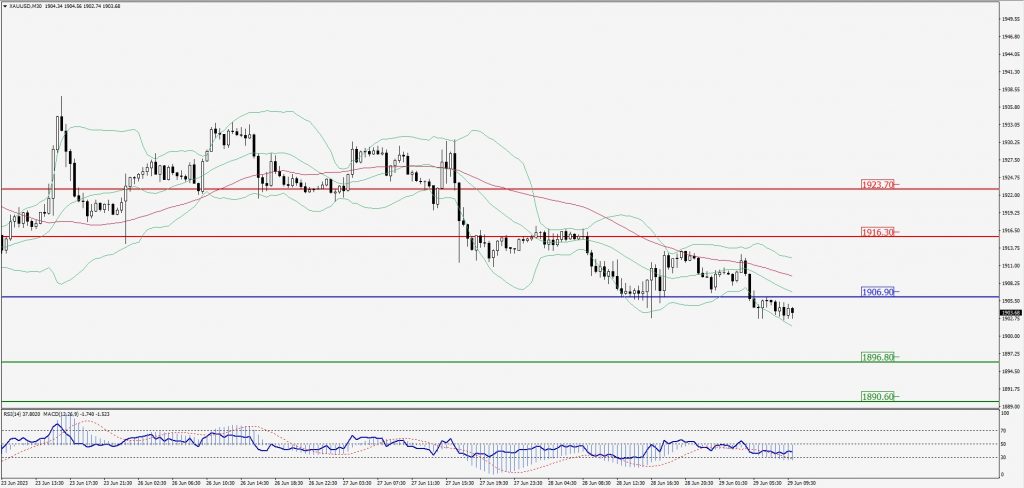
Green Lines Indicate Resistance Levels – Red Lines Indicate Support Levels
Light Blue is a Pivot Point – Black represents the price when the report was produced
Dow Jones Intraday: Trend on the downside
Our pivot point is 33,898.00
Preferable Price Action: Take sell positions below the pivot with targets at 33,815.00 & 33,760.00.
Alternative Price Action: Above 33,898.00 looks for further upside to 33,969.00 & 34,029.00.
Comment: RSI is below 50 levels and Pairs below its 20MA & 55MA.
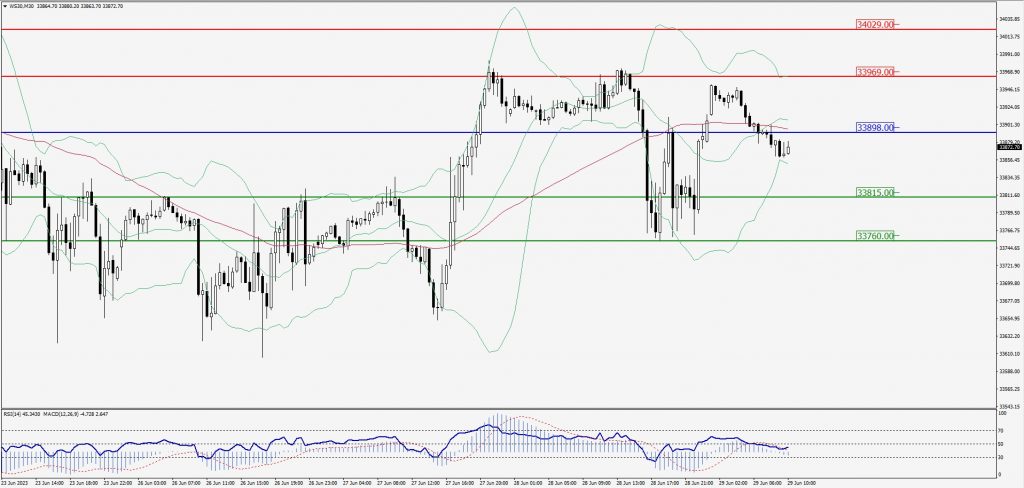
Green Lines Indicate Resistance Levels – Red Lines Indicate Support Levels
Light Blue is a Pivot Point – Black represents the price when the report was produced