Market Wrap: Stocks, Bonds, Commodities
U.S. stock futures were trading lower during Sunday evening as traders monitored continuing debt ceiling negotiations in the U.S., with President Joe Biden and House Speaker Kevin McCarthy scheduled to continue talks later in Monday’s session.
The Dow Jones Industrial Average fell 109.28 points to 33,426.63, the S&P 500 lose 0.14% to 4,191.98 and the Nasdaq Composite subtract 30.94 points to 12,657.90.
MSCI’s index of Asia-Pacific stocks outside Japan is advance 0.76% to 633.24 levels. The Australian index was lower by 0.22% to 7,263.20. Japanese Nikkei Index advance 0.90% today.
European stocks were mixed on Monday, with the Stoxx Europe 50 Index fell 0.08% to 4,391.65, Germany’s DAX decline 0.09% to 16,259.87, and France’s CAC drop 0.13% to 7,482.14 and U.K.’s FTSE 100 add 0.27% to 7,777.80.
Benchmark 10-year U.S. Treasury fell as demand for safe assets ascend again, today 10-year bond yields negative 1.05% to 3.6670.
Oil prices reversed course to fall on Monday after U.S. House Republicans and President Joe Biden’s administration paused talks about raising the government’s debt ceiling, threatening a default that could cut energy demand.
Spot Brent crude oil drop 0.01% to $75.59 per barrel. US West Texas Intermediate crude is down 0.06% to $71.6 a barrel.
The yellow metal gold is advance 0.12% to 1,984.20 dollars per ounce.
Market Wrap: Forex
The dollar was steady against the euro and yen on Monday, as U.S. debt ceiling negotiations were set to resume and after Federal Reserve Chair Jerome Powell indicated he favours a meeting-by-meeting approach when it comes to future policy moves.
Today, the U.S. dollar index measures the Greenback against a trade-weighted basket of six major currencies, which slipped 0.09% to 102.990.
The Euro US Dollar (EUR/USD) is a widely traded pair that is up 0.07% today. This left the pair trading around $1.08160.
The Japanese yen was negative against the U.S. dollar on Monday. Today USD/JPY is slipped 0.38% to the 138.170 level.
Another commodity-related currency mixed against the U.S dollar, AUD/USD fell 0.01% to 0.66470, and NZD/USD surged 0.29% to 0.62850 level.
EUR/USD Intraday: Support level at 1.08130
Our pivot point is at 1.08130
Preferable Price Action: Take buy positions above pivot level with targets at 1.08410 & 1.08620 in extension.
Alternative Price Action: Below pivot looks for a further downside to 1.07860 & 1.075670.
Comment: RSI is above 50 levels and Pairs above 55MA.
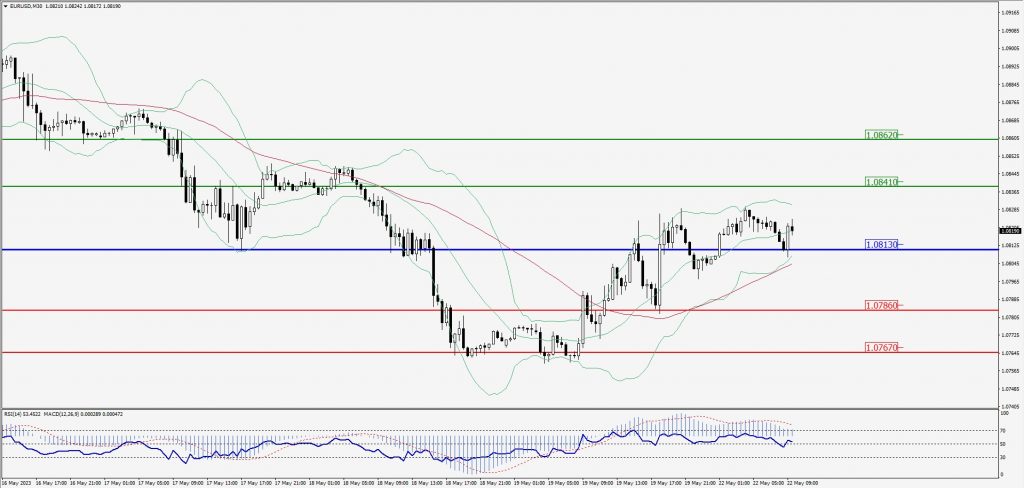
Green Lines Indicate Resistance Levels – Red Lines Indicate Support Levels
Light Blue is a Pivot Point – Black represents the price when the report was produced
GBP/USD Intraday: Trend on the downside
Our pivot point is at 1.24530
Preferable Price Action: Sell positions below pivot with targets at 1.24080 & 1.23780 in extension.
Alternative Price Action: The price above pivot would call for further upside to 1.24080 & 1.23780.
Comment: RSI is below 50 levels and Pairs below 20MA.
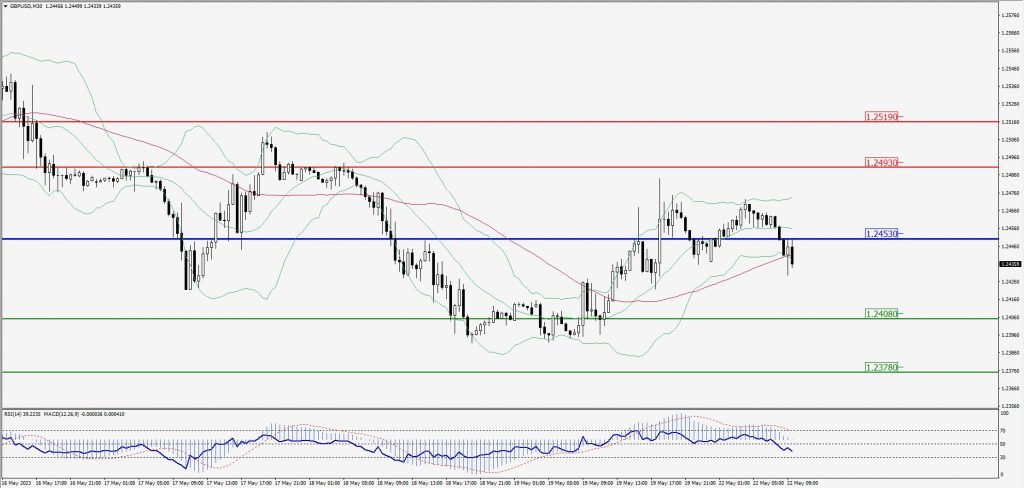
Green Lines Indicate Resistance Levels – Red Lines Indicate Support Levels
Light Blue is a Pivot Point – Black represents the price when the report was produced
USD/JPY Intraday: In a consolidation zone
Our pivot point is at 138.060
Preferable Price Action: Sell position below pivot with the target at 137.370 and 136.840 in extension.
Alternative Price Action: The upside breakout of the pivot would call for 138.750 and 139.300.
Comment: MACD is below 50 level and Pairs below 55MA.
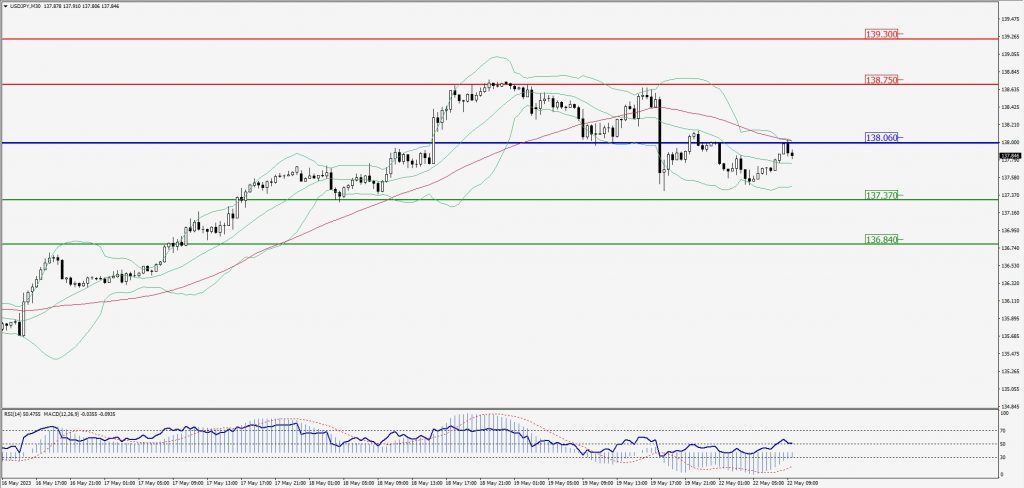
Green Lines Indicate Resistance Levels – Red Lines Indicate Support Levels
Light Blue is a Pivot Point – Black represents the price when the report was produced
AUD/USD Intraday: Trend on the upside
Our pivot point is at 0.66450
Preferable Price Action: Sell positions below pivot with targets at 0.66180 & 0.66020 in extension.
Alternative Price Action: Above pivot looks for a further upside with 0.6680 & 0.66860 as targets.
Comment: RSI is below 50 levels and Pairs below its 20MA & 55MA.
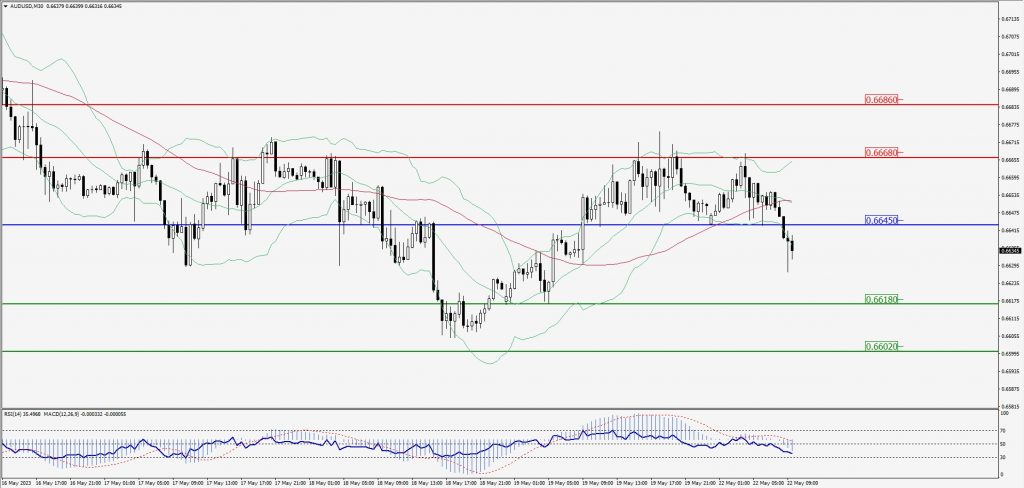
Green Lines Indicate Resistance Levels – Red Lines Indicate Support Levels
Light Blue is a Pivot Point – Black represents the price when the report was produced
CRUDEOIL Intraday: Major trend on the downside
Our pivot point is at 71.20
Preferable Price Action: Below pivot sell oil with 70.34 & 69.83 as targets.
Alternative Price Action: Buy crude above pivot with targets at 71.88 and 72.45 in extension.
Comment: MACD is negative territory and Pairs below its 20MA & 55MA.
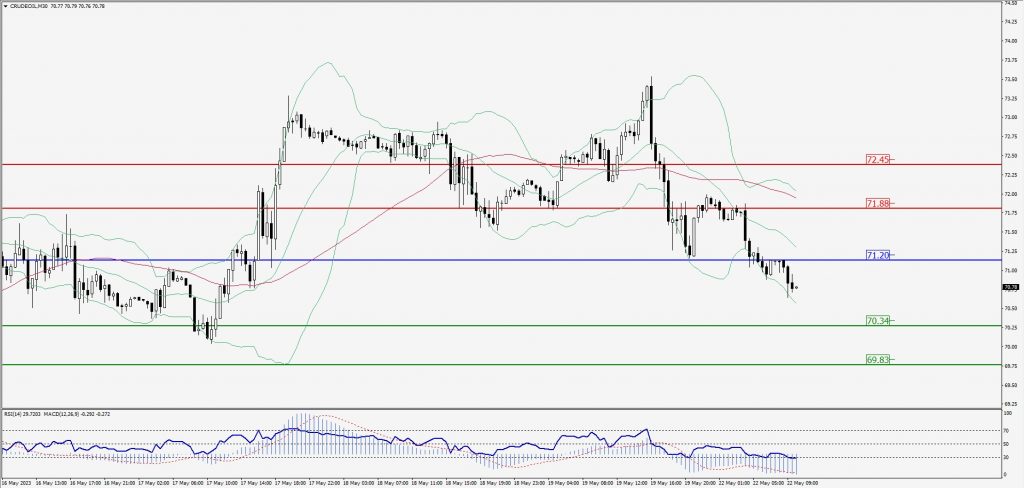
Green Lines Indicate Resistance Levels – Red Lines Indicate Support Levels
Light Blue is a Pivot Point – Black represents the price when the report was produced
XAU/USD Intraday: In a consolidation zone
Our pivot point is 1974.30
Preferable Price Action: Further upside to 1989.00 and 1998.70
Alternative Price Action: If the price gives a downside breakout of a pivot, then the price extends to 1961.20 and 1951.70.
Comment: MACD is above 50 level and Pairs above 55MA.
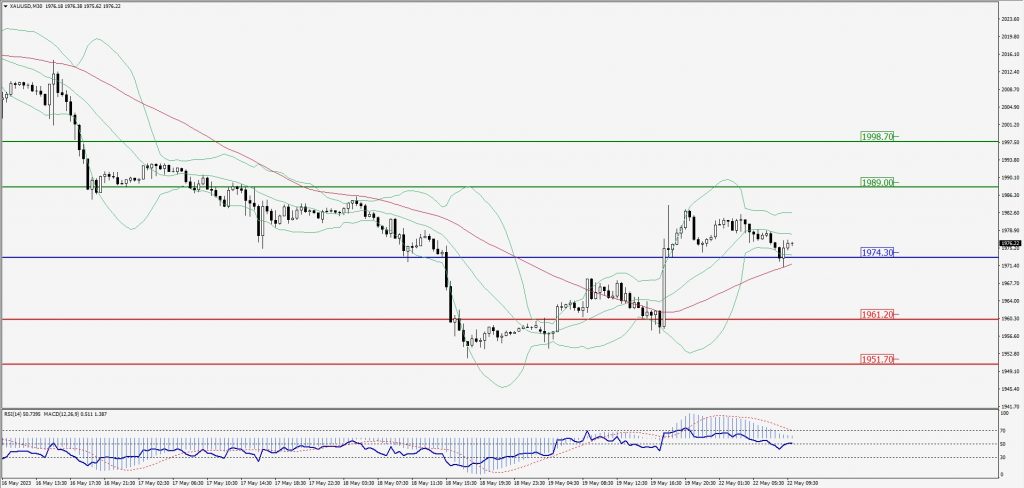
Green Lines Indicate Resistance Levels – Red Lines Indicate Support Levels
Light Blue is a Pivot Point – Black represents the price when the report was produced
Dow Jones Intraday: Resistance level at 33,419.00
Our pivot point is 33,419.00
Preferable Price Action: Take sell positions below the pivot with targets at 33,291.00 & 33,204.00.
Alternative Price Action: Above 33,419.00 looks for further upside to 33,532.00 & 33,623.00.
Comment: RSI is below 50 levels and Pairs below 55MA.
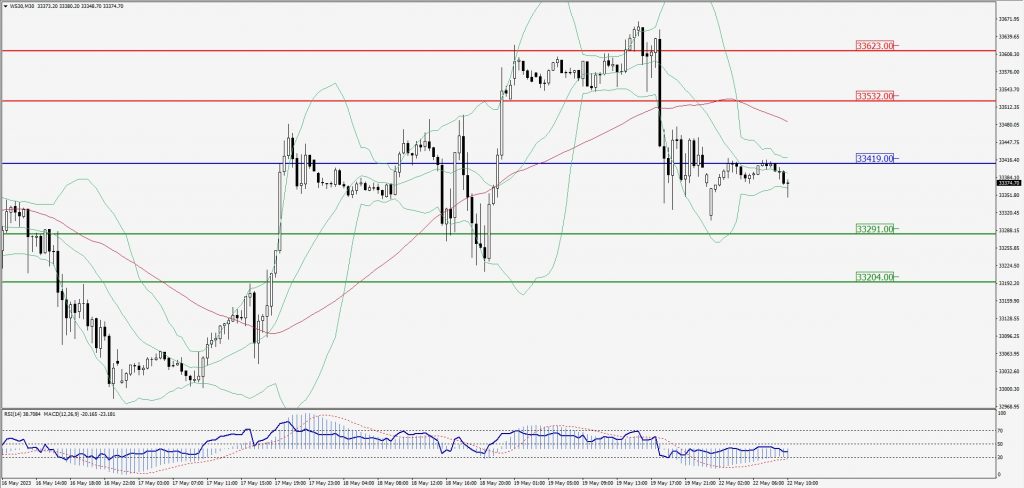
Green Lines Indicate Resistance Levels – Red Lines Indicate Support Levels
Light Blue is a Pivot Point – Black represents the price when the report was produced