Market Wrap: Stocks, Bonds, Commodities
European stock markets traded in a mixed fashion Friday, as investors digested more corporate earnings as well as crucial regional inflation and growth economic data.
The Dow Jones Industrial Average rose 524.29 points to 33,826.16, the S&P 500 gain 1.96% to 4,135.35 and the Nasdaq Composite add 287.89 points to 12,142.24.
MSCI’s index of Asia-Pacific stocks outside Japan is advance 0.38% to 629.21 levels. The Australian index was higher by 0.23% to 7,309.20. Japanese Nikkei Index advance 1.40% today.
European stocks were negative on Friday, with the Stoxx Europe 50 Index fell 0.97% to 4,316.45, Germany’s DAX decline 0.54% to 15,713.95, and France’s CAC drop 0.87% to 7,418.92, and U.K.’s FTSE 100 subtract 0.38% to 7,802.60.
Benchmark 10-year U.S. Treasury fell as demand for safe assets ascend again, today 10-year bond yields negative 1.83% to 3.4630.
Oil prices steadied on Thursday after the previous day’s price drop on worries about a possible recession erased the supportive impact of a surprise cut to OPEC production targets this month.
Spot Brent crude oil drop 0.09% to $78.15 per barrel. US West Texas Intermediate crude is down 0.24% to $74.58 a barrel.
The yellow metal gold is decline 0.35% to 1,992.25 dollars per ounce.
Market Wrap: Forex
The dollar rose on Thursday as weaker-than-expected U.S. economic growth in the first quarter is viewed as not likely to deter the Federal Reserve from raising interest rates next week.
Today, the U.S. dollar index measures the Greenback against a trade-weighted basket of six major currencies, which surged 0.49% to 101.750.
The Euro US Dollar (EUR/USD) is a widely traded pair that is down 0.33% today. This left the pair trading around $1.09910.
The Japanese yen was negative against the U.S. dollar on Friday. Today USD/JPY is surged 1.47% to the 135.890 level.
Another commodity-related currency negative against the U.S dollar, AUD/USD fell 0.69% to 0.65830, and NZD/USD slipped 0.32% to 0.61280 level.
EUR/USD Intraday: Trend on the downside
Our pivot point is at 1.10030
Preferable Price Action: Take sell positions below pivot level with targets at 1.09610 & 1.09370 in extension.
Alternative Price Action: Above pivot looks for a further upside to 1.10410 & 1.10680.
Comment: RSI is below 50 levels and Pairs below its 20MA & 55MA.
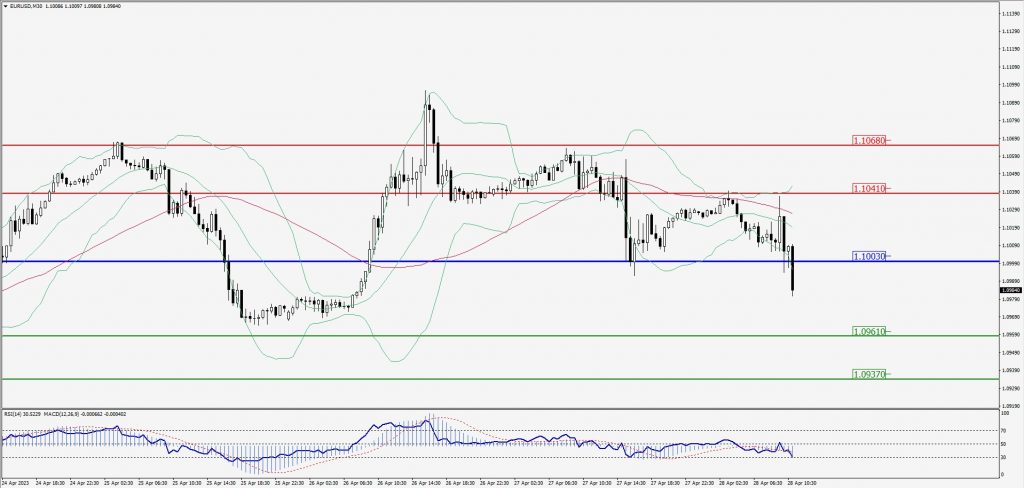
Green Lines Indicate Resistance Levels – Red Lines Indicate Support Levels
Light Blue is a Pivot Point – Black represents the price when the report was produced
GBP/USD Intraday: Trend on the downside
Our pivot point is at 1.24720
Preferable Price Action: Sell positions below pivot with targets at 1.24380 & 1.24170 in extension.
Alternative Price Action: The price above pivot would call for further upside to 1.24990 & 1.25230.
Comment: RSI is below 50 levels and Pairs below its 20MA & 55MA.
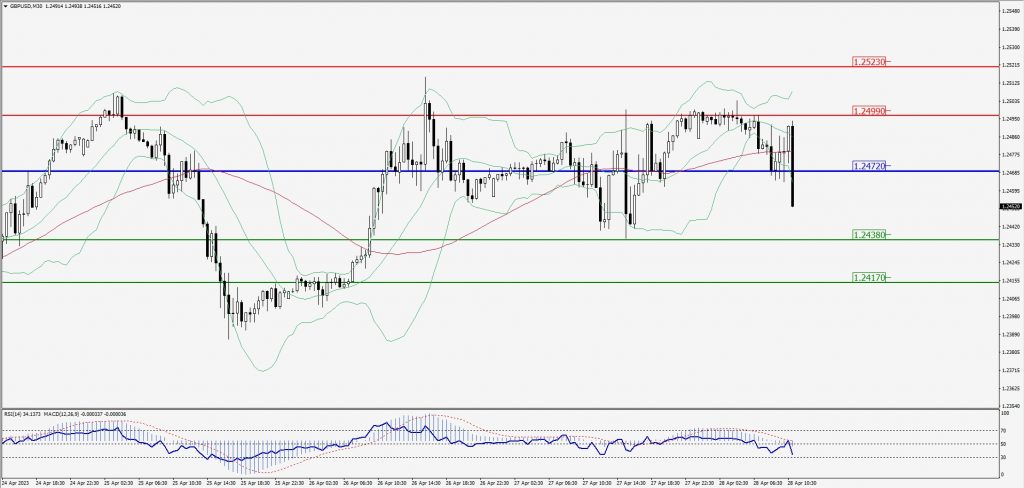
Green Lines Indicate Resistance Levels – Red Lines Indicate Support Levels
Light Blue is a Pivot Point – Black represents the price when the report was produced
USD/JPY Intraday: Major trend on the upside
Our pivot point is at 135.480
Preferable Price Action: Buy position above pivot with the target at 136.090 and 136.480 in extension.
Alternative Price Action: The downside breakout of the pivot would call for 134.920 and 134.520.
Comment: MACD is above 50 level and Pairs above its 20MA & 55MA.
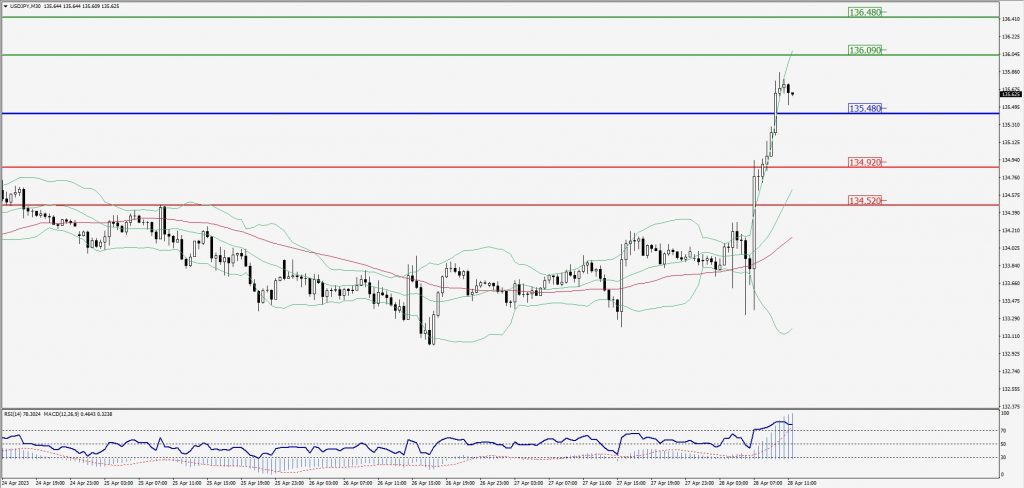
Green Lines Indicate Resistance Levels – Red Lines Indicate Support Levels
Light Blue is a Pivot Point – Black represents the price when the report was produced
AUD/USD Intraday: Trend on the downside
Our pivot point is at 0.65990
Preferable Price Action: Sell positions below pivot with targets at 0.65610 & 0.65350 in extension.
Alternative Price Action: Above pivot looks for a further upside with 0.66360 & 0.66630 as targets.
Comment: RSI is below 50 levels and Pairs below its 20MA & 55MA.
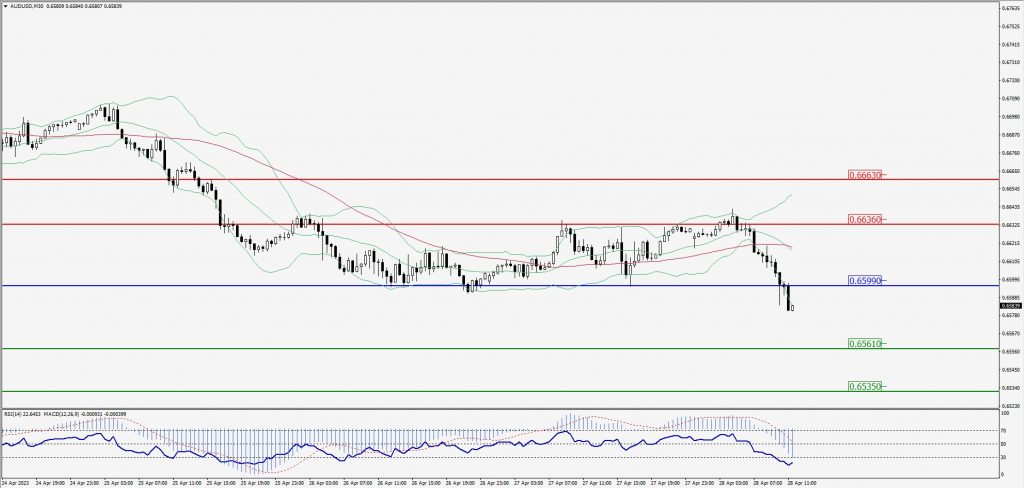
Green Lines Indicate Resistance Levels – Red Lines Indicate Support Levels
Light Blue is a Pivot Point – Black represents the price when the report was produced
CRUDEOIL Intraday: Resistance level at 74.76
Our pivot point is at 74.76
Preferable Price Action: Below pivot sell oil with 73.63 & 72.94 as targets.
Alternative Price Action: Buy crude above pivot with targets at 75.68 and 76.41 in extension.
Comment: MACD is negative territory and Pairs below its 20MA & 55MA.
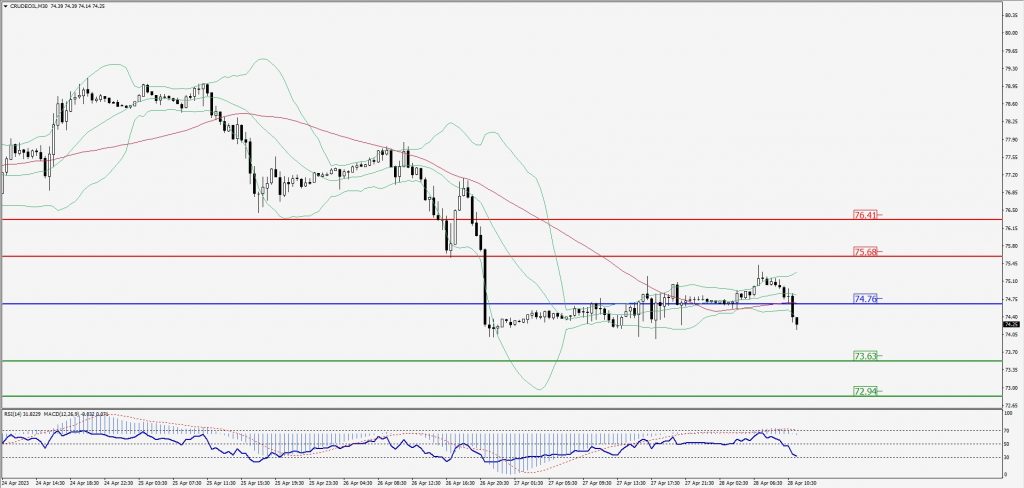
Green Lines Indicate Resistance Levels – Red Lines Indicate Support Levels
Light Blue is a Pivot Point – Black represents the price when the report was produced
XAU/USD Intraday: Trend on the downside
Our pivot point is 1984.10
Preferable Price Action: Further downside to 1976.70 and 1972.00
Alternative Price Action: If the price gives an upside breakout of a pivot, then the price extends to 1990.80 and 1996.50.
Comment: MACD is below 50 level and Pairs below its 20MA & 55MA.
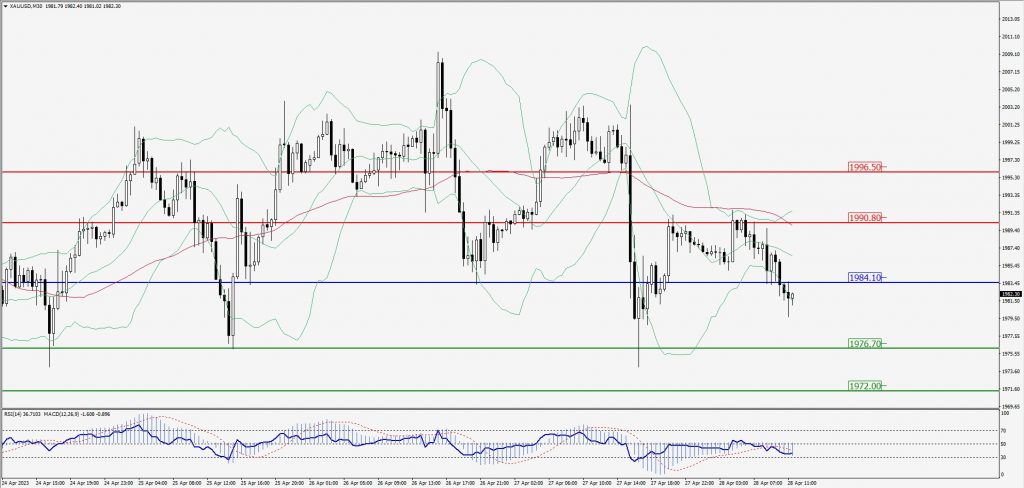
Green Lines Indicate Resistance Levels – Red Lines Indicate Support Levels
Light Blue is a Pivot Point – Black represents the price when the report was produced
Dow Jones Intraday: Trend on the downside
Our pivot point is 33,762.00
Preferable Price Action: Take sell positions above the pivot with targets at 33,582.00 & 33,477.00.
Alternative Price Action: Above 33,762.00 looks for further upside to 33,911.00 & 34,018.00.
Comment: RSI is below 50 levels and Pairs below 20MA.
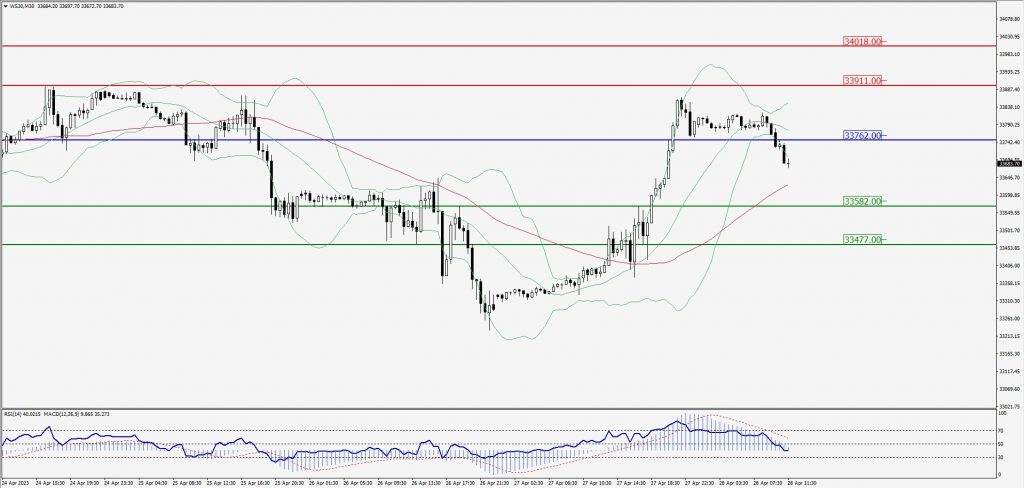
Green Lines Indicate Resistance Levels – Red Lines Indicate Support Levels
Light Blue is a Pivot Point – Black represents the price when the report was produced