Market Wrap: Stocks, Bonds, Commodities
Deutsche Bank is to cut 800 jobs in a new cost-saving drive after reporting a bigger than expected rise in profit for the first quarter, a volatile period globally for finance companies.
The Dow Jones Industrial Average fell 228.96 points to 33,301.87, the S&P 500 lose 0.38% to 4,055.99 and the Nasdaq Composite add 55.19 points to 11,854.35.
MSCI’s index of Asia-Pacific stocks outside Japan is advance 0.28% to 626.45 levels. The Australian index was lower by 0.08% to 7,316.30. Japanese Nikkei Index advance 0.14% today.
European stocks were positive on Thursday, with the Stoxx Europe 50 Index rose 0.29% to 4,360.15, Germany’s DAX advance 0.18% to 15,823.15, and France’s CAC ascend 0.48% to 7,502.59, and U.K.’s FTSE 100 subtract 0.08% to 7,846.35.
Benchmark 10-year U.S. Treasury fell as demand for safe assets ascend again, today 10-year bond yields positive 1.37% to 3.4750.
Oil prices dropped by almost 4 percent on Wednesday, extending the previous session’s sharp losses, even after a report showed US crude inventories fell more than expected, as recession fears grew for the world’s biggest economy.
Spot Brent crude oil ascend 0.46% to $78.08 per barrel. US West Texas Intermediate crude is up 0.32% to $74.50 a barrel.
The yellow metal gold is advance 0.61% to 2,008.30 dollars per ounce.
Market Wrap: Forex
The U.S. dollar weakened in early European trade Thursday ahead of the release of key U.S. growth data, amid concerns over banking contagion risks, a slowing economy and a debt ceiling standoff.
Today, the U.S. dollar index measures the Greenback against a trade-weighted basket of six major currencies, which slipped 0.07% to 101.130.
The Euro US Dollar (EUR/USD) is a widely traded pair that is up 0.13% today. This left the pair trading around $1.10540.
The Japanese yen was negative against the U.S. dollar on Thursday. Today USD/JPY is surged 0.12% to the 133.820 level.
Another commodity-related currency positive against the U.S dollar, AUD/USD rose 0.31% to 0.66190, and NZD/USD surged 0.61% to 0.61530 level.
EUR/USD Intraday: In a consolidation zone
Our pivot point is at 1.103380
Preferable Price Action: Take buy positions above pivot level with targets at 1.10670 & 1.10880 in extension.
Alternative Price Action: Below pivot looks for a further downside to 1.10090 & 1.09880.
Comment: RSI is above 50 levels and Pairs above 55MA.
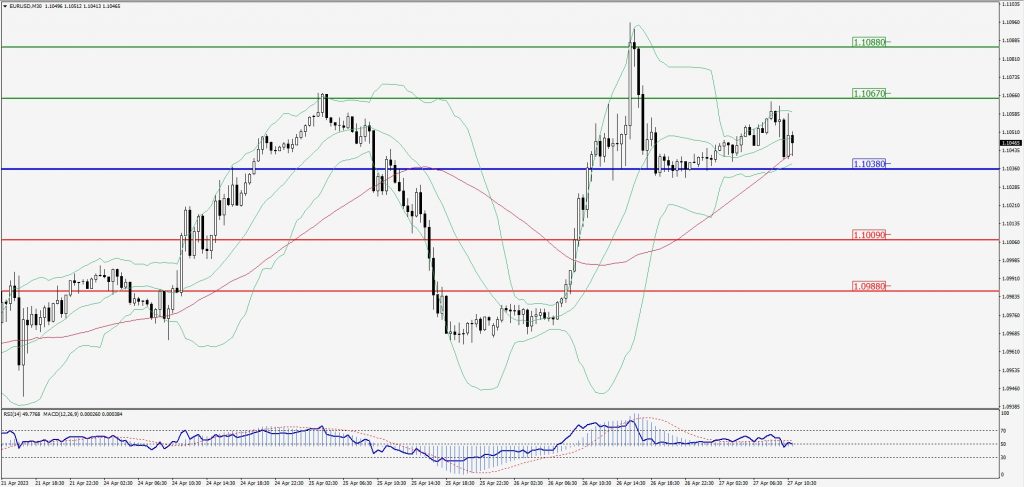
Green Lines Indicate Resistance Levels – Red Lines Indicate Support Levels
Light Blue is a Pivot Point – Black represents the price when the report was produced
GBP/USD Intraday: Trend on the downside
Our pivot point is at 1.24730
Preferable Price Action: Sell positions below pivot with targets at 1.24470 & 1.24300 in extension.
Alternative Price Action: The price above pivot would call for further upside to 1.24970 & 1.25150.
Comment: RSI is below 50 levels and Pairs below 20MA.
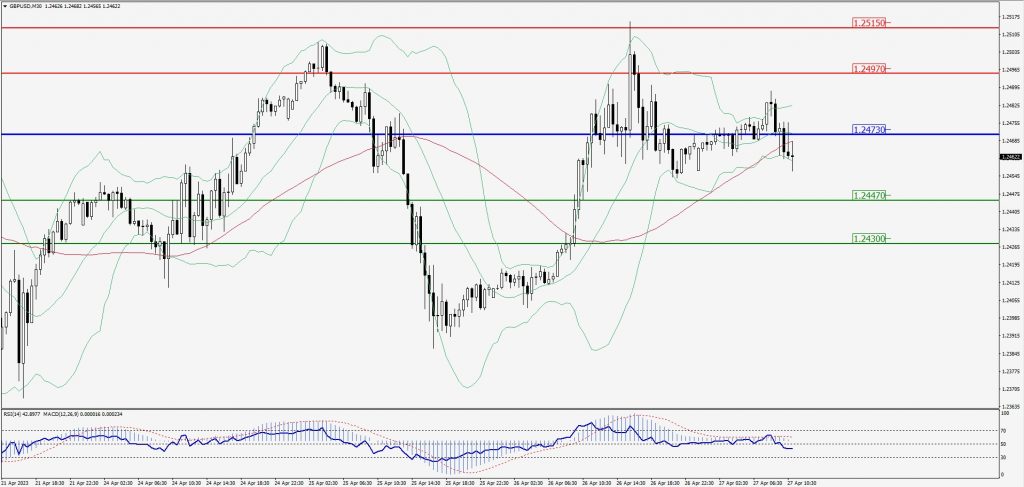
Green Lines Indicate Resistance Levels – Red Lines Indicate Support Levels
Light Blue is a Pivot Point – Black represents the price when the report was produced
USD/JPY Intraday: Trend on the upside
Our pivot point is at 133.770
Preferable Price Action: Buy position above pivot with the target at 134.140 and 134.400 in extension.
Alternative Price Action: The downside breakout of the pivot would call for 133.420 and 133.200.
Comment: MACD is above 50 level and Pairs above its 20MA & 55MA.
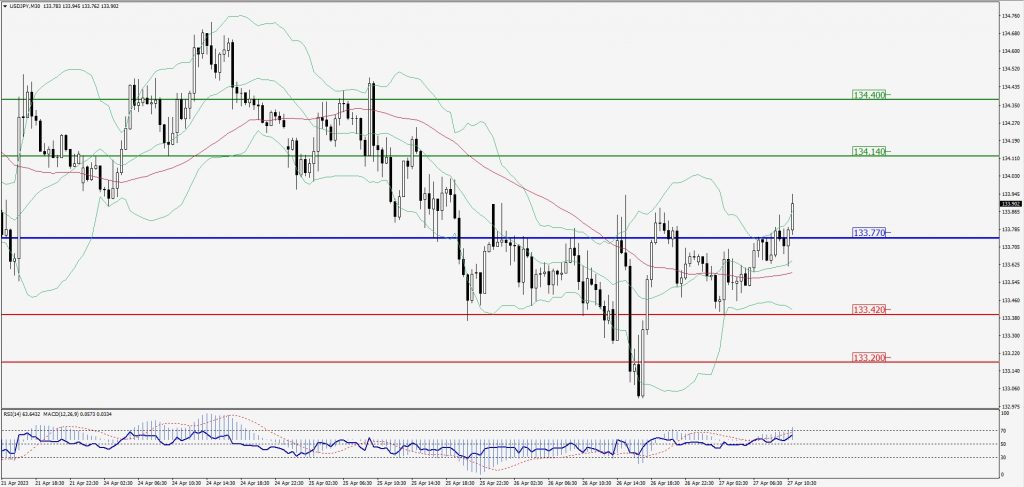
Green Lines Indicate Resistance Levels – Red Lines Indicate Support Levels
Light Blue is a Pivot Point – Black represents the price when the report was produced
AUD/USD Intraday: Support level at 0.66110
Our pivot point is at 0.66110
Preferable Price Action: Buy positions above pivot with targets at 0.66350 & 0.66530 in extension.
Alternative Price Action: Below pivot looks for a further downside with 0.65900 & 0.65750 as targets.
Comment: RSI is above 50 levels and Pairs above its 20MA & 55MA.
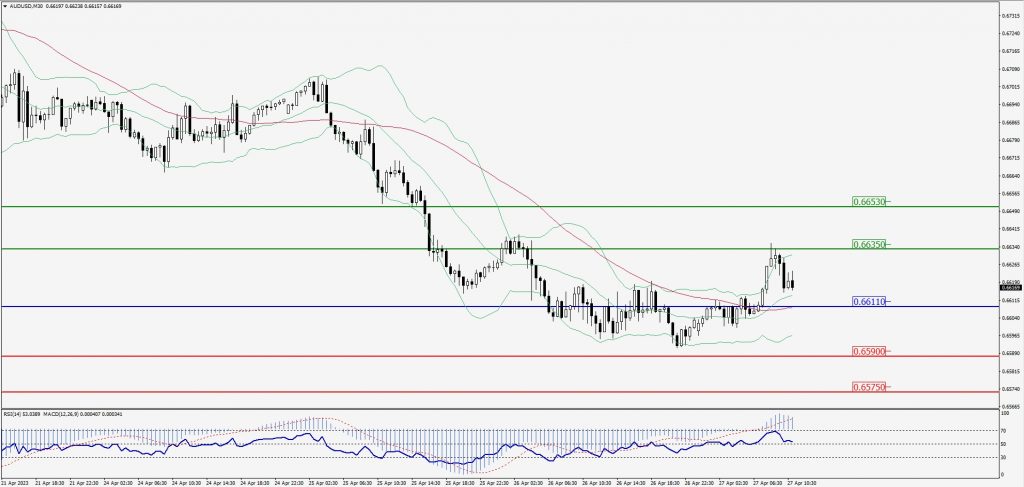
Green Lines Indicate Resistance Levels – Red Lines Indicate Support Levels
Light Blue is a Pivot Point – Black represents the price when the report was produced
CRUDEOIL Intraday: Resistance level at 74.75
Our pivot point is at 74.75
Preferable Price Action: Below pivot sell oil with 73.89 & 73.19 as targets.
Alternative Price Action: Buy crude above pivot with targets at 75.63 and 76.31 in extension.
Comment: MACD is negative territory and Pairs below 55MA.
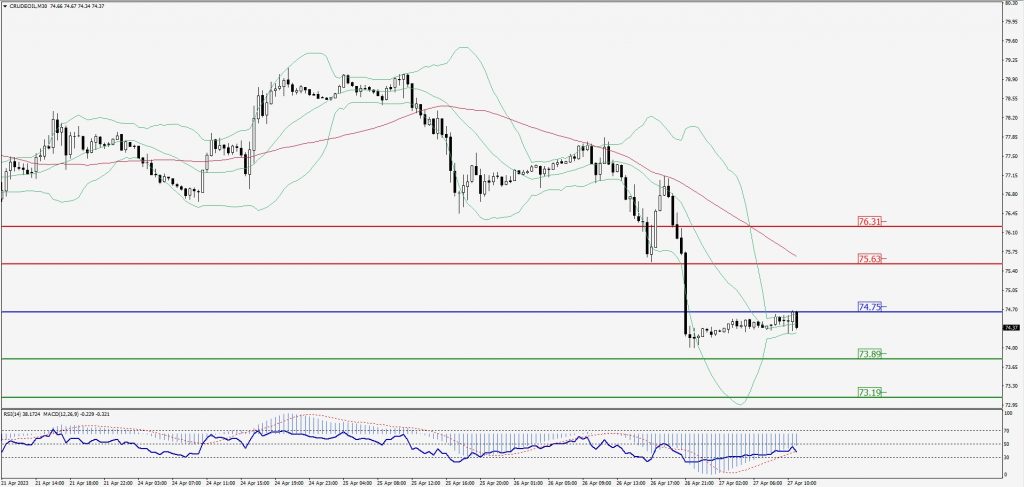
Green Lines Indicate Resistance Levels – Red Lines Indicate Support Levels
Light Blue is a Pivot Point – Black represents the price when the report was produced
XAU/USD Intraday: Trend on the upside
Our pivot point is 1995.90
Preferable Price Action: Further upside to 2003.90 and 2010.20
Alternative Price Action: If the price gives a downside breakout of a pivot, then the price extends to 1988.20 and 1982.00.
Comment: MACD is above 50 level and Pairs above its 20MA & 55MA.
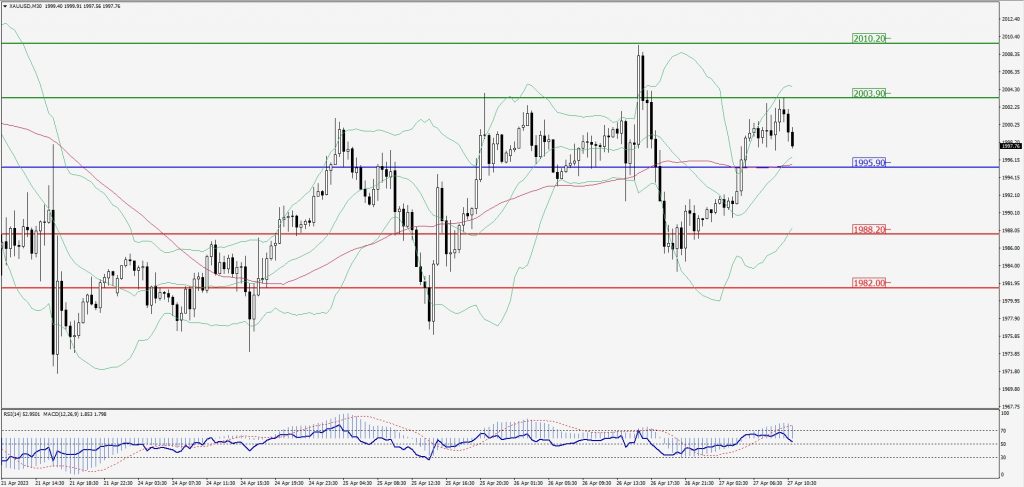
Green Lines Indicate Resistance Levels – Red Lines Indicate Support Levels
Light Blue is a Pivot Point – Black represents the price when the report was produced
Dow Jones Intraday: Trend on the upside
Our pivot point is 33,353.00
Preferable Price Action: Take sell positions above the pivot with targets at 33,436.00 & 33,509.00.
Alternative Price Action: Below 33,353.00 looks for further downside to 33,275.00 & 33,204.00.
Comment: RSI is above 50 levels and Pairs above 20MA.
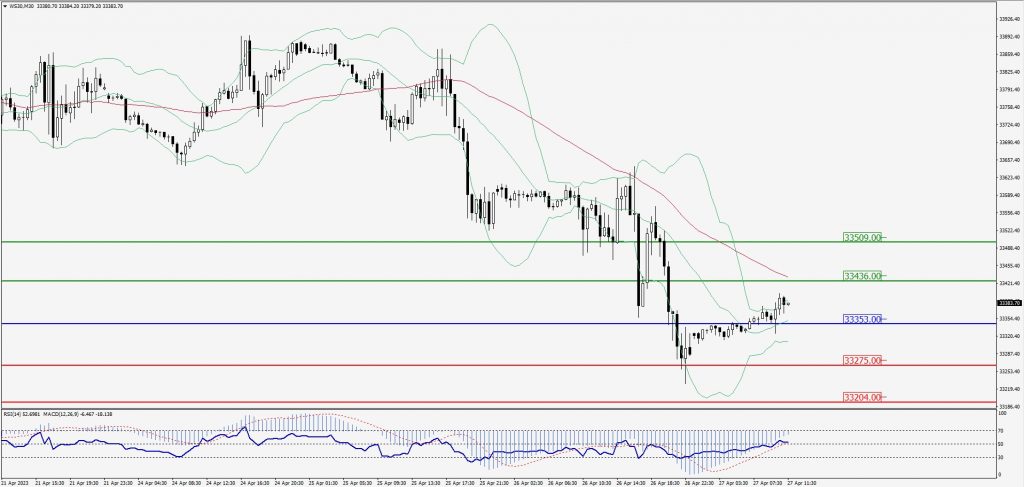
Green Lines Indicate Resistance Levels – Red Lines Indicate Support Levels
Light Blue is a Pivot Point – Black represents the price when the report was produced