Market Wrap: Stocks, Bonds, Commodities
US stock futures rose Tuesday evening as Big Tech earnings began to roll out, led by Alphabet and Microsoft. Futures tied to the Dow Jones Industrial Average gained 47 points or 0.1 percent.
The Dow Jones Industrial Average fell 344.57 points to 33,530.83, the S&P 500 lose 1.58% to 4,071.63 and the Nasdaq Composite subtract 238.05 points to 11,799.16.
MSCI’s index of Asia-Pacific stocks outside Japan is decline 0.23% to 624.07 levels. The Australian index was lower by 0.08% to 7,316.30. Japanese Nikkei Index decline 0.71% today.
European stocks were negative on Wednesday, with the Stoxx Europe 50 Index fell 0.62% to 4,350.75, Germany’s DAX decline 0.52% to 15,791.78, and France’s CAC drop 0.66% to 7,481.85, and U.K.’s FTSE 100 subtract 0.28% to 7,869.37.
Benchmark 10-year U.S. Treasury fell as demand for safe assets ascend again, today 10-year bond yields positive 0.43% to 3.4130.
Oil dropped 2 percent on Tuesday after two sessions of gains as deepening concerns of an economic slowdown and a stronger dollar outweighed hopes of higher Chinese demand and lower U.S. crude stocks.
Spot Brent crude oil ascend 0.78% to $81.23 per barrel. US West Texas Intermediate crude is up 0.96% to $77.80 a barrel.
The yellow metal gold is advance 0.15% to 2,007.60 dollars per ounce.
Market Wrap: Forex
The U.S. dollar edged lower in early European trade Wednesday, handing back some of its sharp overnight gains which were prompted by continuing concerns about an economic slowdown and the health of the U.S. banking system.
Today, the U.S. dollar index measures the Greenback against a trade-weighted basket of six major currencies, which slipped 0.45% to 101.130.
The Euro US Dollar (EUR/USD) is a widely traded pair that is up 0.64% today. This left the pair trading around $1.10420.
The Japanese yen was negative against the U.S. dollar on Wednesday. Today USD/JPY is slipped 0.13% to the 133.550 level.
Another commodity-related currency negative against the U.S dollar, AUD/USD fell 0.29% to 0.66040, and NZD/USD slipped 0.11% to 0.61290 level.
EUR/USD Intraday: Major trend on the upside
Our pivot point is at 1.10120
Preferable Price Action: Take buy positions above pivot level with targets at 1.10440 & 1.10670 in extension.
Alternative Price Action: Below pivot looks for a further downside to 1.09820 & 1.09600.
Comment: RSI is above 50 levels and Pairs above its 20MA & 55MA.
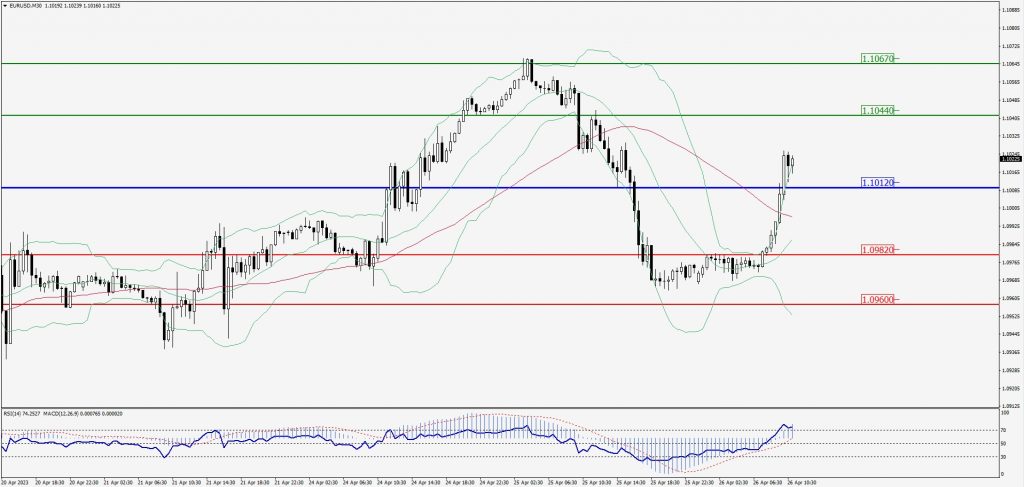
Green Lines Indicate Resistance Levels – Red Lines Indicate Support Levels
Light Blue is a Pivot Point – Black represents the price when the report was produced
GBP/USD Intraday: Trend on the upside
Our pivot point is at 1.24880
Preferable Price Action: Sell positions below pivot with targets at 1.24630 & 1.24490 in extension.
Alternative Price Action: The price above pivot would call for further upside to 1.25080 & 1.25120.
Comment: RSI is below 50 levels and Pairs below 20MA.
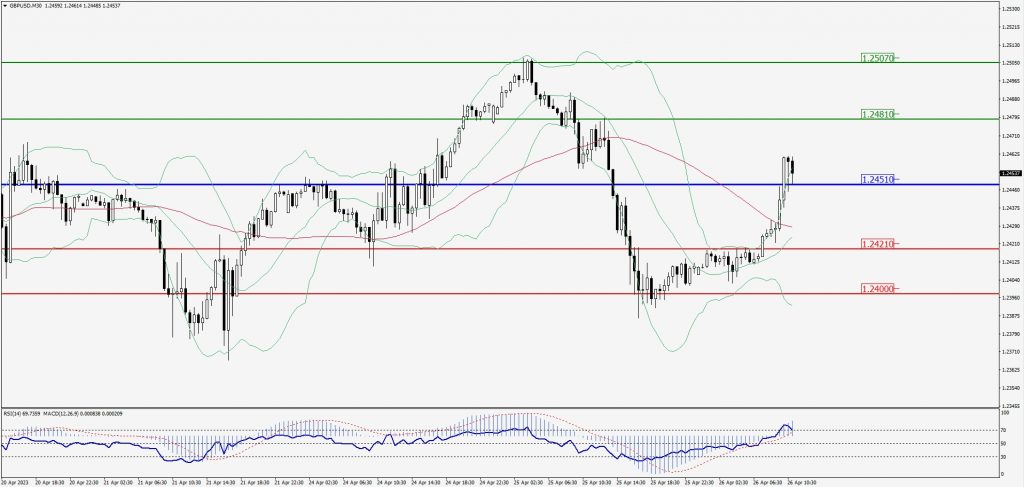
Green Lines Indicate Resistance Levels – Red Lines Indicate Support Levels
Light Blue is a Pivot Point – Black represents the price when the report was produced
USD/JPY Intraday: Trend on the downside
Our pivot point is at 133.700
Preferable Price Action: Sell position below pivot with the target at 133.360 and 133.140 in extension.
Alternative Price Action: The upside breakout of the pivot would call for 134.010 and 134.270.
Comment: MACD is below 50 level and Pairs below 55MA.
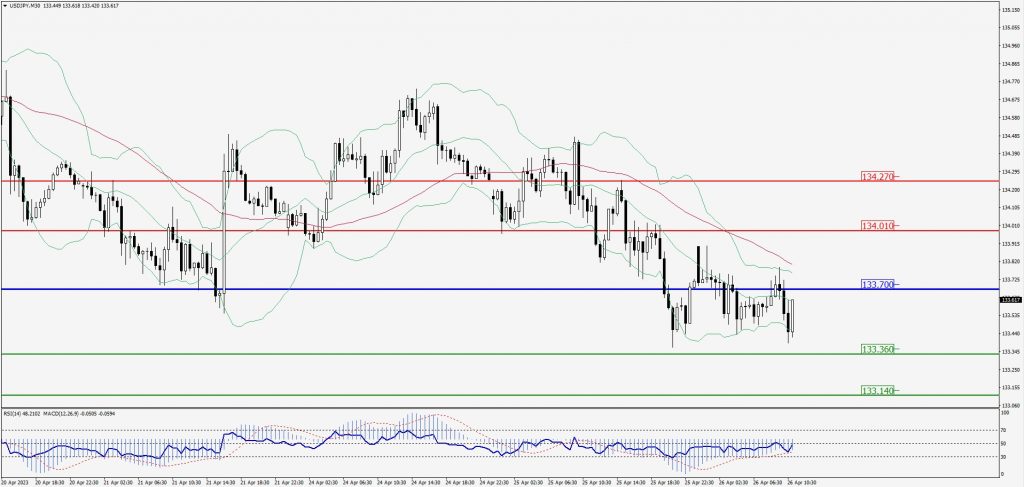
Green Lines Indicate Resistance Levels – Red Lines Indicate Support Levels
Light Blue is a Pivot Point – Black represents the price when the report was produced
AUD/USD Intraday: Resistance level at 0.66230
Our pivot point is at 0.66230
Preferable Price Action: Sell positions below pivot with targets at 0.65810 & 0.65550 in extension.
Alternative Price Action: Above pivot looks for a further upside with 0.66610 & 0.66890 as targets.
Comment: RSI is below 50 levels and Pairs below its 20MA & 55MA.
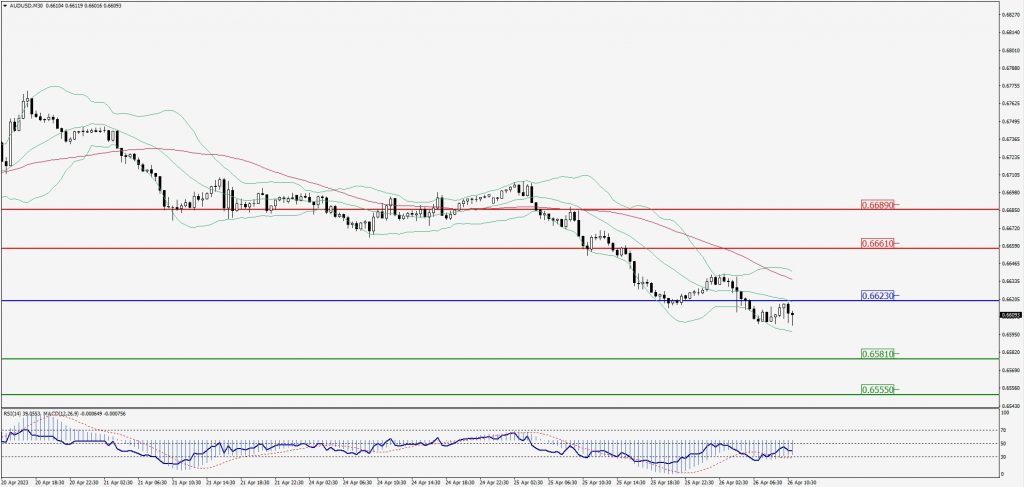
Green Lines Indicate Resistance Levels – Red Lines Indicate Support Levels
Light Blue is a Pivot Point – Black represents the price when the report was produced
CRUDEOIL Intraday: Trend on the downside
Our pivot point is at 77.59
Preferable Price Action: Below pivot sell oil with 76.98 & 76.59 as targets.
Alternative Price Action: Buy crude above pivot with targets at 78.20 and 78.71 in extension.
Comment: MACD is negative territory and Pairs below 55MA.
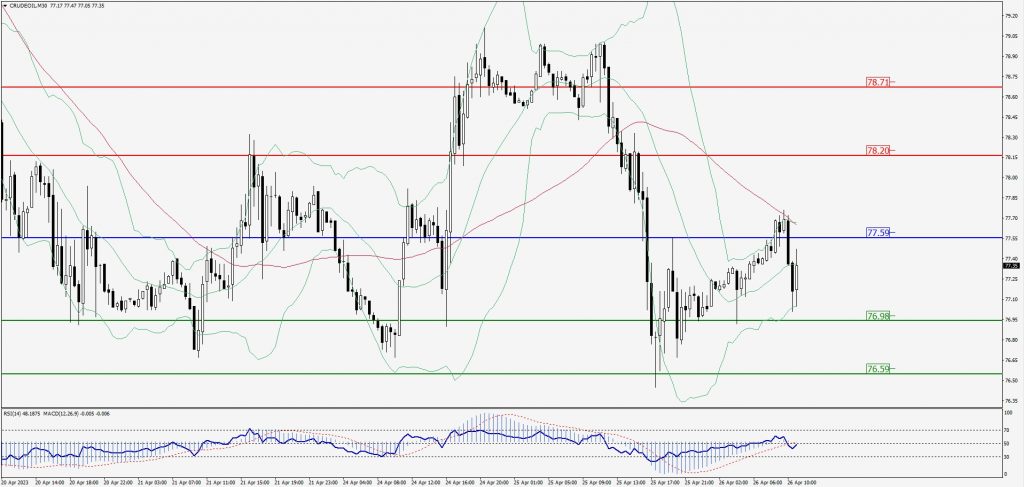
Green Lines Indicate Resistance Levels – Red Lines Indicate Support Levels
Light Blue is a Pivot Point – Black represents the price when the report was produced
XAU/USD Intraday: Support level at 1995.90
Our pivot point is 1995.90
Preferable Price Action: Further upside to 1999.50 and 2004.30
Alternative Price Action: If the price gives a downside breakout of a pivot, then the price extends to 1988.20 and 1982.00.
Comment: MACD is above 50 level and Pairs above 55MA.
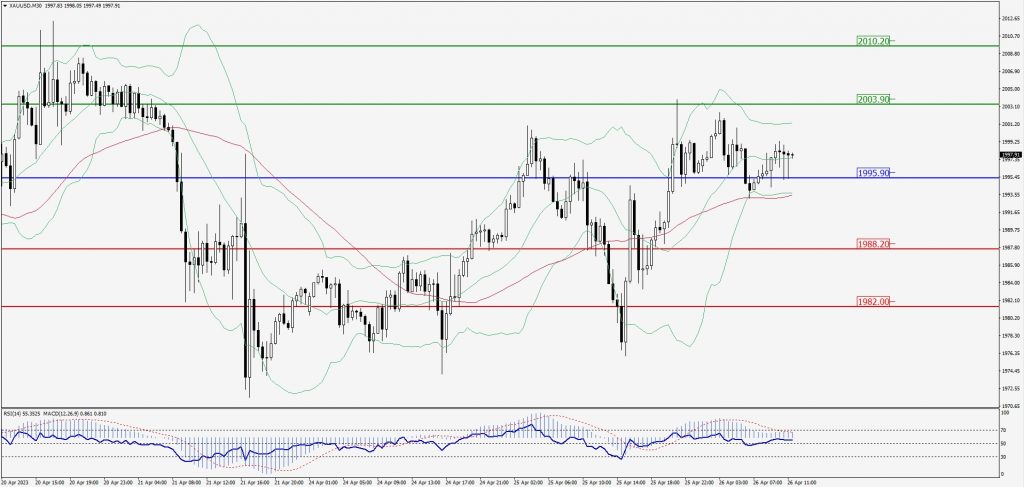
Green Lines Indicate Resistance Levels – Red Lines Indicate Support Levels
Light Blue is a Pivot Point – Black represents the price when the report was produced
Dow Jones Intraday: Resistance level at 33,606.00
Our pivot point is 33,606.00
Preferable Price Action: Take sell positions below the pivot with targets at 33,506.00 & 33,433.00.
Alternative Price Action: Above 33,606.00 looks for further upside to 33,696.00 & 33,767.00.
Comment: RSI is below 50 levels and Pairs below 55MA.
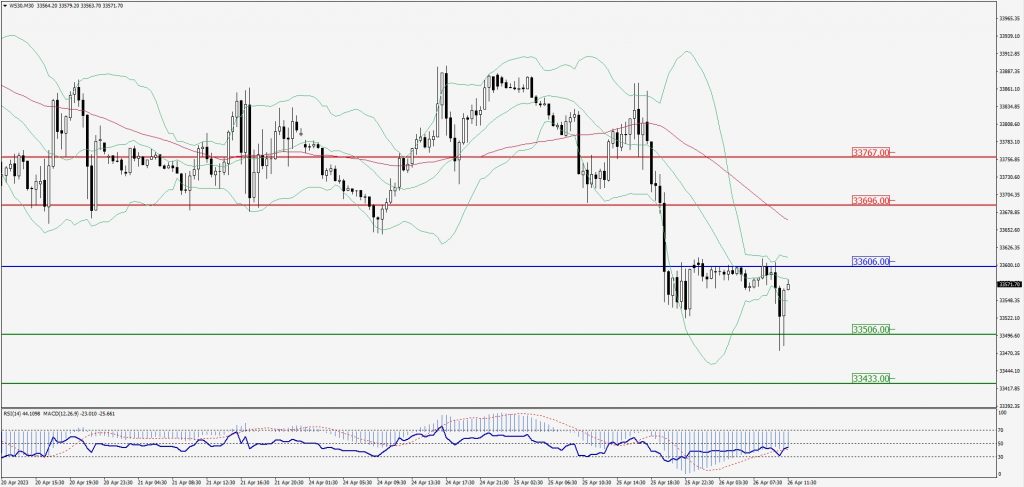
Green Lines Indicate Resistance Levels – Red Lines Indicate Support Levels
Light Blue is a Pivot Point – Black represents the price when the report was produced