Market Wrap: Stocks, Bonds, Commodities
Australia stocks were higher after the close on Friday, as gains in the Gold, Metals & Mining and Materials sectors led shares higher.
The Dow Jones Industrial Average rose 383.19 points to 34,029.69, the S&P 500 gain 1.33% to 4,146.22 and the Nasdaq Composite add 236.93 points to 12,166.27.
MSCI’s index of Asia-Pacific stocks outside Japan is advance 0.52% to 647.98 levels. The Australian index was higher by 0.51% to 7,361.60. Japanese Nikkei Index advance 1.20% today.
European stocks were positive on Friday, with the Stoxx Europe 50 Index rose 0.14% to 4,370.15, Germany’s DAX advance 0.22% to 15,764.85, and France’s CAC ascend 0.18% to 7,494.05, and U.K.’s FTSE 100 add 0.21% to 7,860.40.
Benchmark 10-year U.S. Treasury fell as demand for safe assets ascend again, today 10-year bond yields are negative 0.40% to 3.4370.
Oil prices edged lower on Friday after the West’s energy watchdog warned that output cuts announced by OPEC+ producers could exacerbate an oil supply deficit and hurt consumers.
Spot Brent crude oil drop 0.10% to $86.00 per barrel. US West Texas Intermediate crude is down 0.07% to $82.09 a barrel.
The yellow metal gold is decline 0.38% to 2,047.35 dollars per ounce.
Market Wrap: Forex
The U.S. dollar slumped to a one-year low in early European trade Friday on raised expectations that cooler-than-expected inflation data will result in an early end to the Federal Reserve’s rate-tightening cycle.
Today, the U.S. dollar index measures the Greenback against a trade-weighted basket of six major currencies, which slipped 0.10% to 100.620.
The Euro US Dollar (EUR/USD) is a widely traded pair that is up 0.14% today. This left the pair trading around $1.10600.
The Japanese yen was negative against the U.S. dollar on Friday. Today USD/JPY is slipped 0.10% to the 132.410 level.
Another commodity-related currency negative against the U.S dollar, AUD/USD fell 0.18% to 0.67690, and NZD/USD slipped 0.02% to 0.62930 level.
EUR/USD Intraday: Trend on the upside
Our pivot point is at 1.10490
Preferable Price Action: Take buy positions above pivot level with targets at 1.11060 & 1.11480 in extension.
Alternative Price Action: Below pivot looks for a further downside to 1.10000 & 1.09620.
Comment: RSI is above 50 levels and Pairs above 55MA.
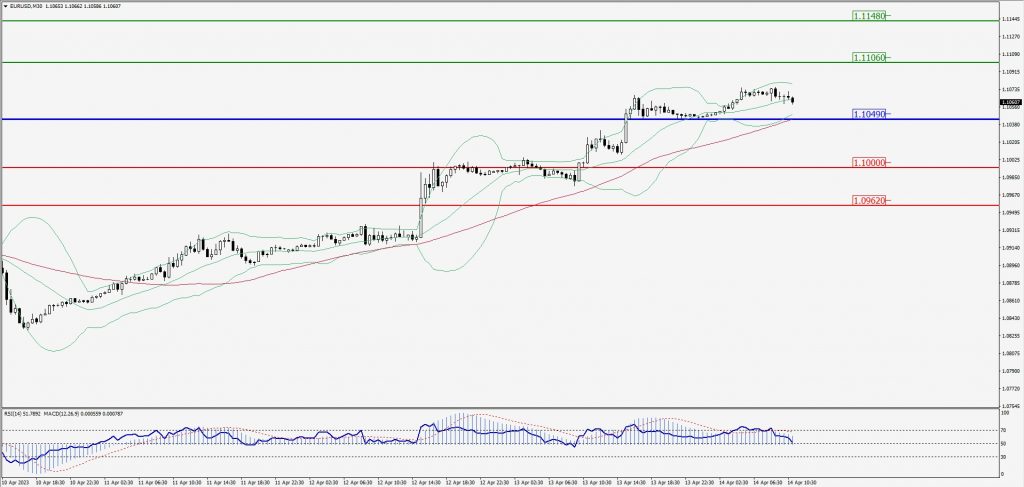
Green Lines Indicate Resistance Levels – Red Lines Indicate Support Levels
Light Blue is a Pivot Point – Black represents the price when the report was produced
GBP/USD Intraday: Trend on the downside
Our pivot point is at 1.25230
Preferable Price Action: Sell positions below pivot with targets at 1.24900 & 1.24710 in extension.
Alternative Price Action: The price above pivot would call for further upside to 1.25510 & 1.25740.
Comment: RSI is below 50 levels and Pairs below its 20MA & 55MA.
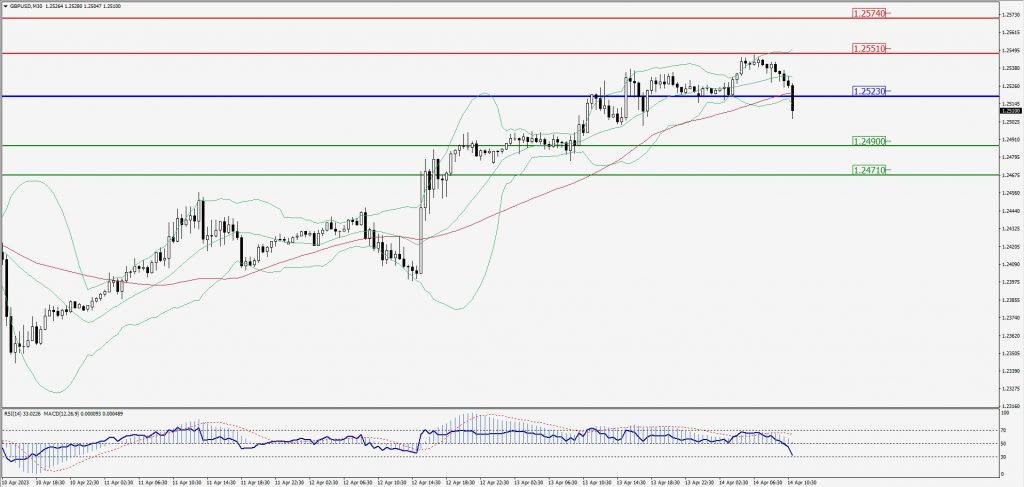
Green Lines Indicate Resistance Levels – Red Lines Indicate Support Levels
Light Blue is a Pivot Point – Black represents the price when the report was produced
USD/JPY Intraday: Trend on the downside
Our pivot point is at 132.470
Preferable Price Action: Sell position below pivot with the target at 132.140 and 131.900 in extension.
Alternative Price Action: The upside breakout of the pivot would call for 132.740 and 132.940.
Comment: MACD is below 50 level and Pairs below its 20MA & 55MA.
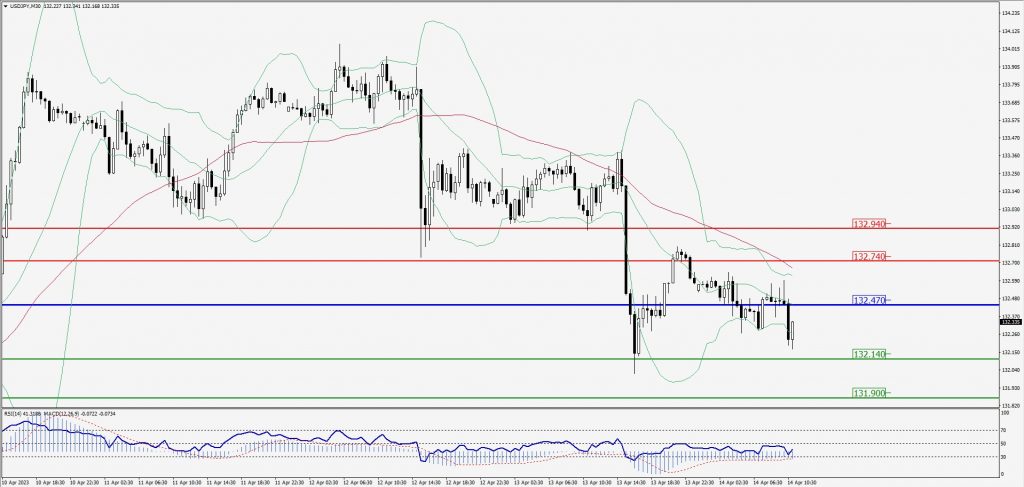
Green Lines Indicate Resistance Levels – Red Lines Indicate Support Levels
Light Blue is a Pivot Point – Black represents the price when the report was produced
AUD/USD Intraday: Resistance level at 0.67870
Our pivot point is at 0.67870
Preferable Price Action: Sell positions below pivot with targets at 0.67590 & 0.67400 in extension.
Alternative Price Action: Above pivot looks for a further upside with 0.68130 & 0.68320 as targets.
Comment: RSI is below 50 levels and Pairs below 20MA.
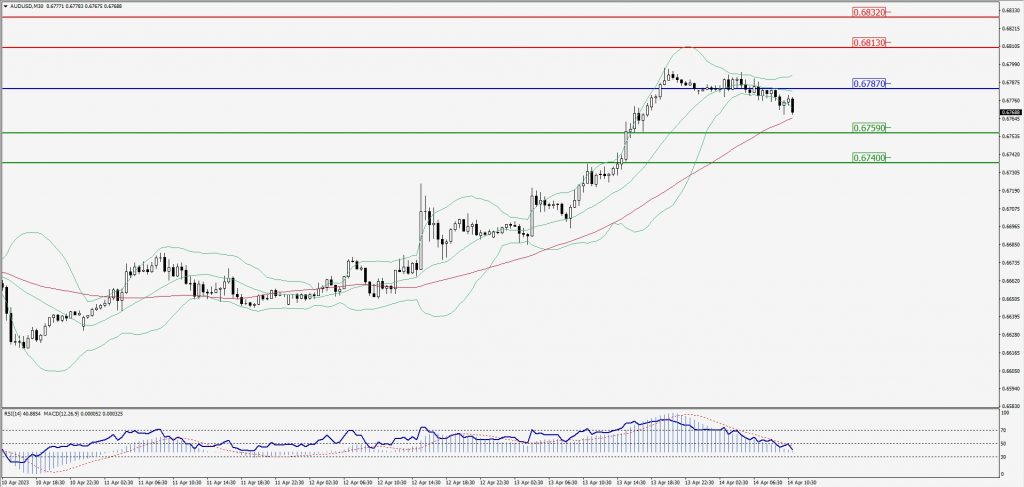
Green Lines Indicate Resistance Levels – Red Lines Indicate Support Levels
Light Blue is a Pivot Point – Black represents the price when the report was produced
CRUDEOIL Intraday: Trend on the downside
Our pivot point is at 82.29
Preferable Price Action: Below pivot sell oil with 81.71 & 81.32 as targets.
Alternative Price Action: Buy crude above pivot with targets at 82.86 and 83.31 in extension.
Comment: MACD is negative territory and Pairs below its 20MA & 55MA.
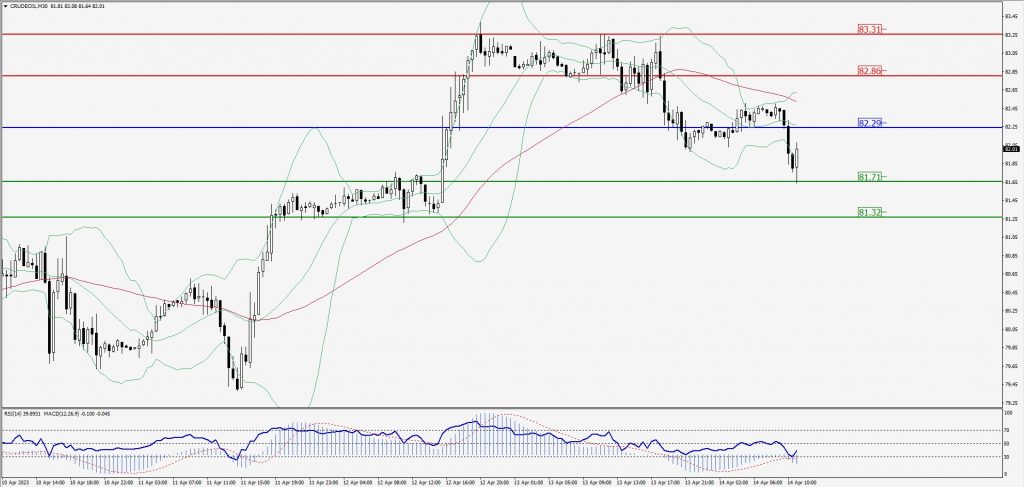
Green Lines Indicate Resistance Levels – Red Lines Indicate Support Levels
Light Blue is a Pivot Point – Black represents the price when the report was produced
XAU/USD Intraday: Trend on the downside
Our pivot point is 2038.50
Preferable Price Action: Further downside to 2026.80 and 2018.90
Alternative Price Action: If the price gives an upside breakout of a pivot, then the price extends to 2048.60 and 2056.30.
Comment: MACD is below 50 level and Pairs below its 20MA & 55MA.
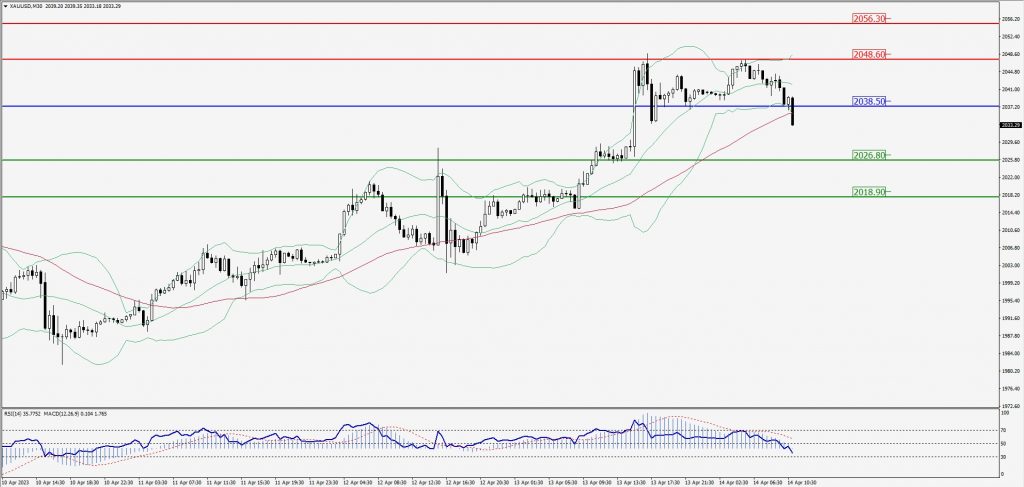
Green Lines Indicate Resistance Levels – Red Lines Indicate Support Levels
Light Blue is a Pivot Point – Black represents the price when the report was produced
Dow Jones Intraday: Resistance level at 34,001.00
Our pivot point is 34,001.00
Preferable Price Action: Take sell positions below the pivot with targets at 33,885.00 & 33,792.00.
Alternative Price Action: Above 34,001.00 looks for further upside to 34,112.00 & 34,196.00.
Comment: RSI is below 50 levels and Pairs below 20MA.
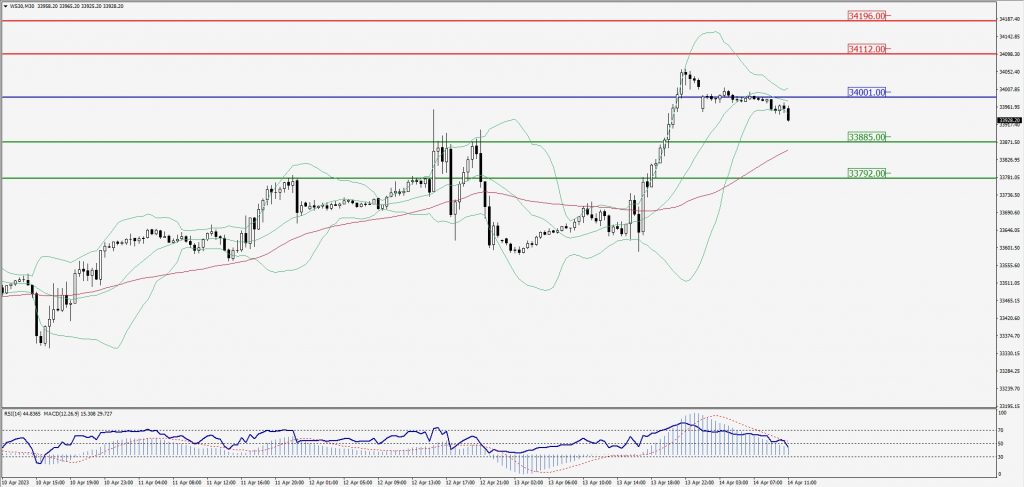
Green Lines Indicate Resistance Levels – Red Lines Indicate Support Levels
Light Blue is a Pivot Point – Black represents the price when the report was produced