Market Wrap: Stocks, Bonds, Commodities
Wall Street futures were little changed on Wednesday evening, as investors weighed recession risk following the latest meeting minutes from the Federal Reserve.
The Dow Jones Industrial Average fell 38.29 points to 33,646.50, the S&P 500 lose 0.41% to 4,091.95 and the Nasdaq Composite subtract 0.85 points to 11,929.34.
MSCI’s index of Asia-Pacific stocks outside Japan is advance 0.13% to 643.88 levels. The Australian index was lower by 0.27% to 7,324.10. Japanese Nikkei Index advance 0.26% today.
European stocks were mixed on Thursday, with the Stoxx Europe 50 Index rose 0.32% to 4,347.85, Germany’s DAX decline 0.02% to 15,701.09, and France’s CAC ascend 0.95% to 7,467.04, and U.K.’s FTSE 100 subtract 0.06% to 7,820.34.
Benchmark 10-year U.S. Treasury fell as demand for safe assets ascend again, today 10-year bond yields are positive 0.04% to 3.4220.
Oil prices rose sharply on Wednesday after U.S. economic data showed that inflation in the world’s biggest oil consumer rose moderately in March.
Spot Brent crude oil drop 0.13% to $87.19 per barrel. US West Texas Intermediate crude is down 0.08% to $83.19 a barrel.
The yellow metal gold is advance 0.77% to 2,040.65 dollars per ounce.
Market Wrap: Forex
The U.S. dollar edged higher in early European trade Thursday, but remained under pressure after cooler-than-expected inflation data raised the possibility of an early end to the Federal Reserve’s rate-tightening cycle.
Today, the U.S. dollar index measures the Greenback against a trade-weighted basket of six major currencies, which slipped 0.15% to 101.020.
The Euro US Dollar (EUR/USD) is a widely traded pair that is up 0.24% today. This left the pair trading around $1.10150.
The Japanese yen was negative against the U.S. dollar on Thursday. Today USD/JPY is surged 0.05% to the 133.190 level.
Another commodity-related currency positive against the U.S dollar, AUD/USD rose 0.53% to 0.67240, and NZD/USD surged 0.24% to 0.62360 level.
EUR/USD Intraday: Trend on the upside
Our pivot point is at 1.09850
Preferable Price Action: Take buy positions above pivot level with targets at 1.10280 & 1.10590 in extension.
Alternative Price Action: Below pivot looks for a further downside to 1.09460 & 1.09190.
Comment: RSI is above 50 levels and Pairs above its 20MA & 55MA.
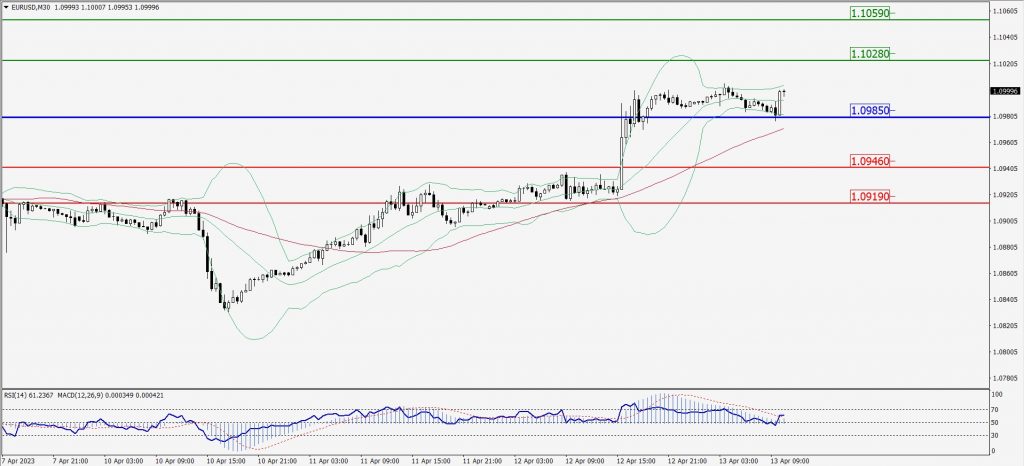
Green Lines Indicate Resistance Levels – Red Lines Indicate Support Levels
Light Blue is a Pivot Point – Black represents the price when the report was produced
GBP/USD Intraday: Support level at 1.24890
Our pivot point is at 1.24890
Preferable Price Action: Buy positions above pivot with targets at 1.25270 & 1.25540 in extension.
Alternative Price Action: The price below pivot would call for further downside to 1.24570 & 1.24320.
Comment: RSI is above 50 levels and Pairs above its 20MA & 55MA.
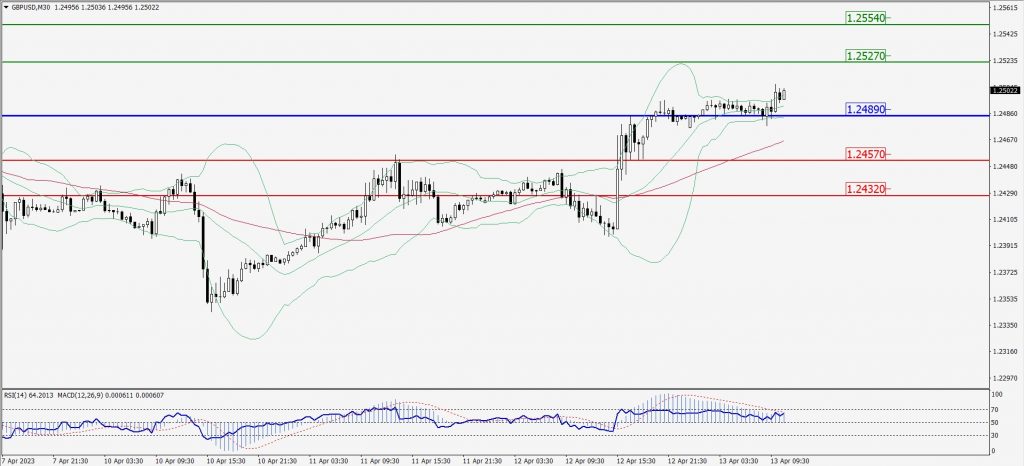
Green Lines Indicate Resistance Levels – Red Lines Indicate Support Levels
Light Blue is a Pivot Point – Black represents the price when the report was produced
USD/JPY Intraday: Trend on the downside
Our pivot point is at 133.200
Preferable Price Action: Sell position below pivot with the target at 132.750 and 132.410 in extension.
Alternative Price Action: The upside breakout of the pivot would call for 133.630 and 133.950.
Comment: MACD is below 50 level and Pairs below its 20MA & 55MA.
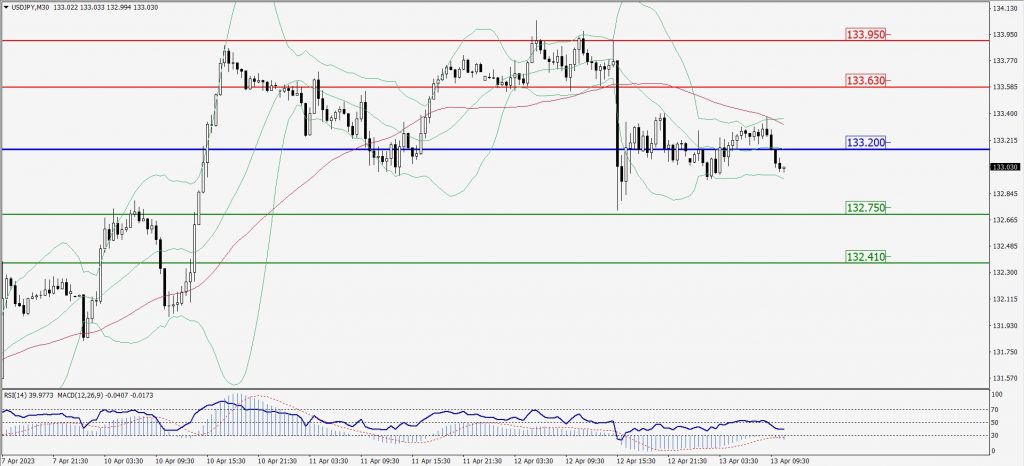
Green Lines Indicate Resistance Levels – Red Lines Indicate Support Levels
Light Blue is a Pivot Point – Black represents the price when the report was produced
AUD/USD Intraday: Trend on the upside
Our pivot point is at 0.67190
Preferable Price Action: Buy positions above pivot with targets at 0.67470 & 0.67660 in extension.
Alternative Price Action: Below pivot looks for a further downside with 0.66950 & 0.66760 as targets.
Comment: RSI is above 50 levels and Pairs above its 20MA & 55MA.
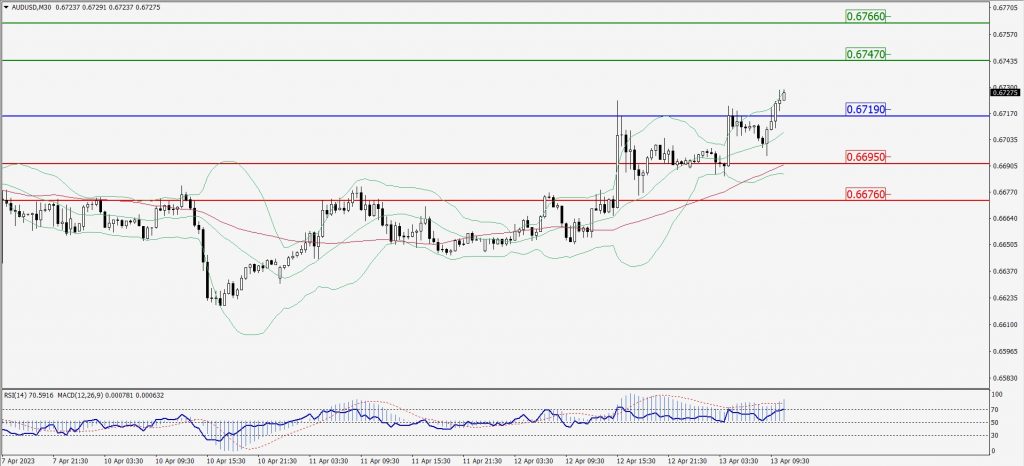
Green Lines Indicate Resistance Levels – Red Lines Indicate Support Levels
Light Blue is a Pivot Point – Black represents the price when the report was produced
CRUDEOIL Intraday: Support level at 82.97
Our pivot point is at 82.97
Preferable Price Action: Above pivot buy oil with 83.87 & 84.49 as targets.
Alternative Price Action: Sell crude below pivot with targets at 82.24 and 81.70 in extension.
Comment: MACD is positive territory and Pairs above its 20MA & 55MA.
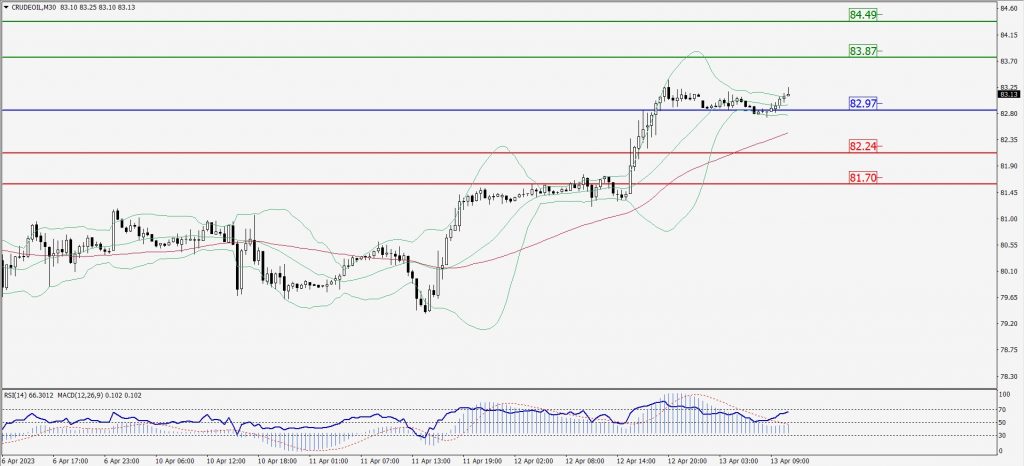
Green Lines Indicate Resistance Levels – Red Lines Indicate Support Levels
Light Blue is a Pivot Point – Black represents the price when the report was produced
XAU/USD Intraday: Major trend on the upside
Our pivot point is 2023.40
Preferable Price Action: Further upside to 2033.70 and 2041.00
Alternative Price Action: If the price gives a downside breakout of a pivot, then the price extends to 2015.10 and 2007.70.
Comment: MACD is above 50 level and Pairs above its 20MA & 55MA.
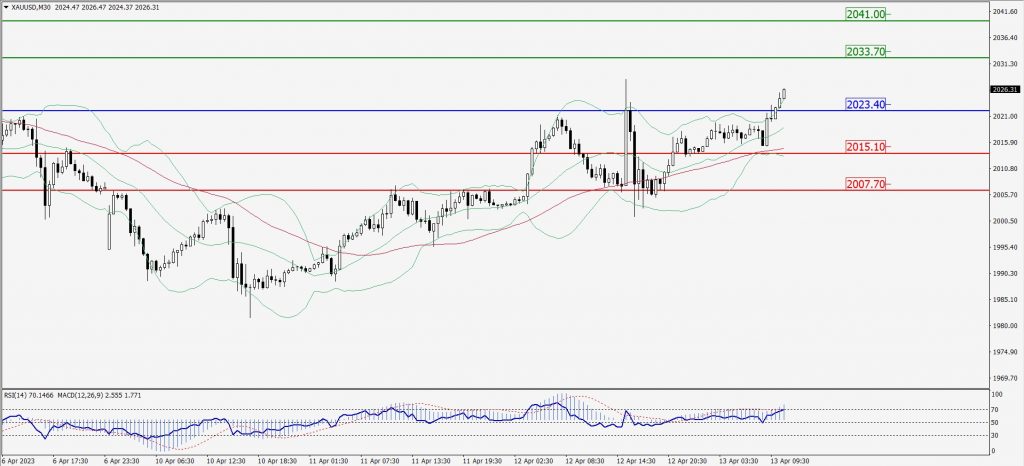
Green Lines Indicate Resistance Levels – Red Lines Indicate Support Levels
Light Blue is a Pivot Point – Black represents the price when the report was produced
Dow Jones Intraday: Trend on the upside
Our pivot point is 33,666.00
Preferable Price Action: Take buy positions above the pivot with targets at 33,784.00 & 33,875.00.
Alternative Price Action: Below 33,666.00 looks for further downside to 33,563.00 & 33,483.00.
Comment: RSI is above 50 levels and Pairs above 20MA.
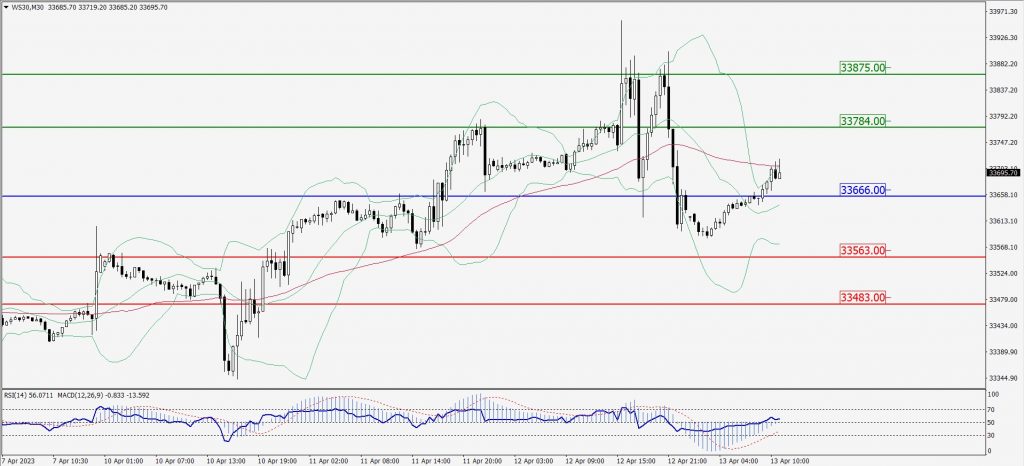
Green Lines Indicate Resistance Levels – Red Lines Indicate Support Levels
Light Blue is a Pivot Point – Black represents the price when the report was produced