Market Wrap: Stocks, Bonds, Commodities
The Dow Jones Industrial Average advanced on Thursday to its fourth record close in the last five sessions, as stronger-than-expected monthly retail sales indicated a robust U.S. consumer and TSMC’s upbeat forecast buoyed chipmakers’ stocks.
The Dow Jones Industrial Average rose 161.35 points to 43,239.05, the S&P 500 loss 0.02% to 5,841.47 and the Nasdaq Composite ascend 6.53 points to 18,373.61.
MSCI’s index of Asia-Pacific stocks outside Japan is up 0.99% to 751.12 levels. The Australian index was lower by 0.87% to 8,283.20. Japanese Nikkei Index increase 0.11% today.
European stocks were mixed on Friday, with the Stoxx Europe 50 Index increase 0.12% to 4,953.35 Germany’s DAX descend 0.05% to 19,578.34, and France’s CAC higher 0.05% to 7,587.34 and U.K.’s FTSE 100 loss 0.36% to 8,355.27.
Benchmark 10-year U.S. Treasury rose as demand for safe assets slipped again, today 10-year bond yields 0.32% to 4.1110.
Crude oil futures inched higher on Friday, supported by a surprise drop in U.S. oil inventories and simmering Middle East tensions, but prices were headed for their biggest weekly loss in more than a month on worries of lower demand.
Spot Brent crude oil increase 0.42% to $74.76 per barrel. US West Texas Intermediate crude is increase 0.44% to $71.00 a barrel.
The yellow metal gold is up 0.56% to 2,722.70 dollars per ounce.
Market Wrap: Forex
The dollar headed for a third weekly gain in a row on Friday, helped by a dovish European Central Bank and strong U.S. data that are pushing out expectations for how fast U.S. rates can fall, particularly if Donald Trump wins the presidency.
Today, the U.S. dollar index measures the Greenback against a trade-weighted basket of six major currencies, which decrease 0.16% to 103.482.
The Euro US Dollar (EUR/USD) is a widely traded is up 0.08% today. This left the pair trading around $1.08400.
The Japanese yen was will move negative against the U.S. dollar on Friday. Today USD/JPY is trades pair that decrease 0.17% to the 149.940 level.
Another commodity-related currency positive against the U.S dollar, AUD/USD gain 0.25% to 0.67130, and NZD/USD increase 0.17% to 0.60690 level.
EUR/USD Intraday: Trend on the upside
Our pivot point is at 1.08430
Preferable Price Action: Take buy positions above pivot level with targets at 1.08590 & 1.08740 in extension.
Alternative Price Action: Sell pivot looks for a further downside to 1.08270 & 1.08120.
Comment: RSI is above 50 levels and pairs above its 20MA.
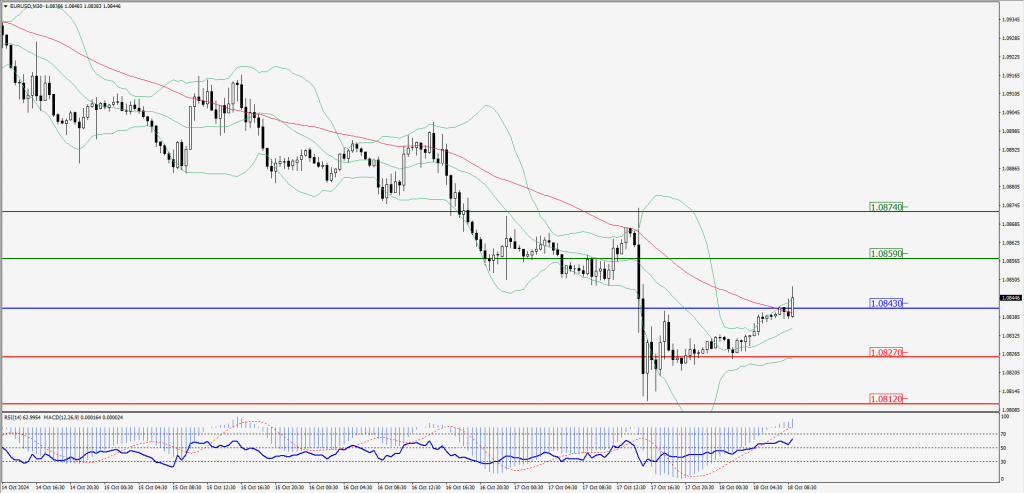
Green Lines Indicate Resistance Levels – Red Lines Indicate Support Levels
Light Blue is a Pivot Point – Black represents the price when the report was produced
GBP/USD Intraday: Major trend on the upside
Our pivot point is at 1.30600
Preferable Price Action: Buy positions above pivot with targets at 1.30780 & 1.30940 in extension.
Alternative Price Action: The price below pivot would call for further downside to 1.30420 & 1.30250.
Comment: RSI is above 50 levels and pairs above its 20MA & 55MA.
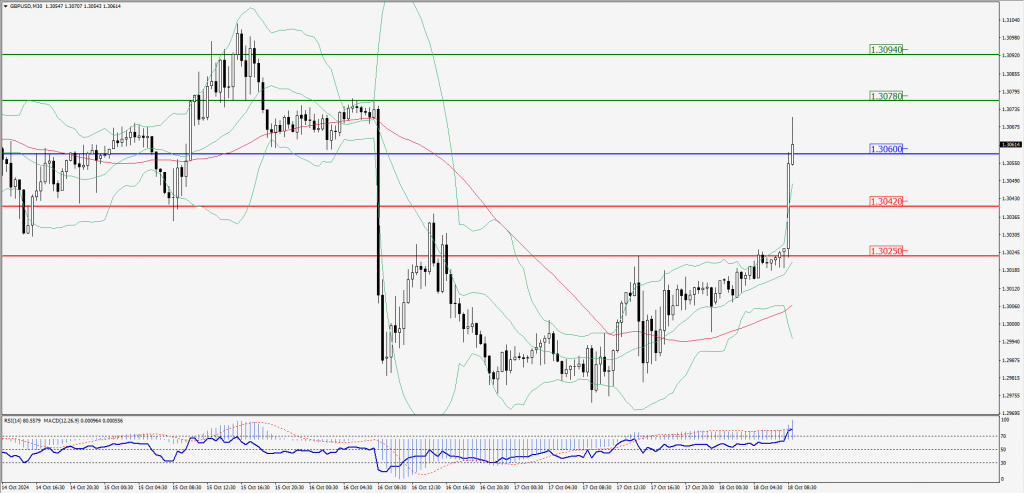
Green Lines Indicate Resistance Levels – Red Lines Indicate Support Levels
Light Blue is a Pivot Point – Black represents the price when the report was produced
USD/JPY Intraday: Trend on the downside
Our pivot point is at 150.020
Preferable Price Action: Sell position below pivot with the target at 149.860 and 149.690 in extension.
Alternative Price Action: The upside breakout of the pivot would call for 150.190 and 150.350.
Comment: MACD is below 50 levels and pairs below its 20MA.
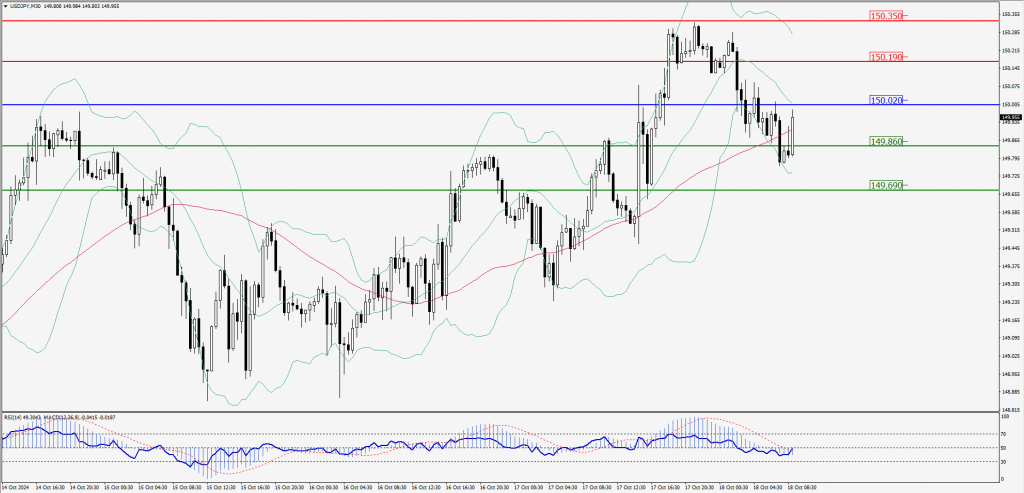
Green Lines Indicate Resistance Levels – Red Lines Indicate Support Levels
Light Blue is a Pivot Point – Black represents the price when the report was produced
AUD/USD Intraday: Trend on the upside
Our pivot point is at 0.67100
Preferable Price Action: Buy positions above pivot with targets at 0.67210 & 0.67310 in extension.
Alternative Price Action: Below pivot a further downside with 0.66990 & 0.66900 as targets.
Comment: RSI is above 50 levels and pairs above its 55MA & 20MA.
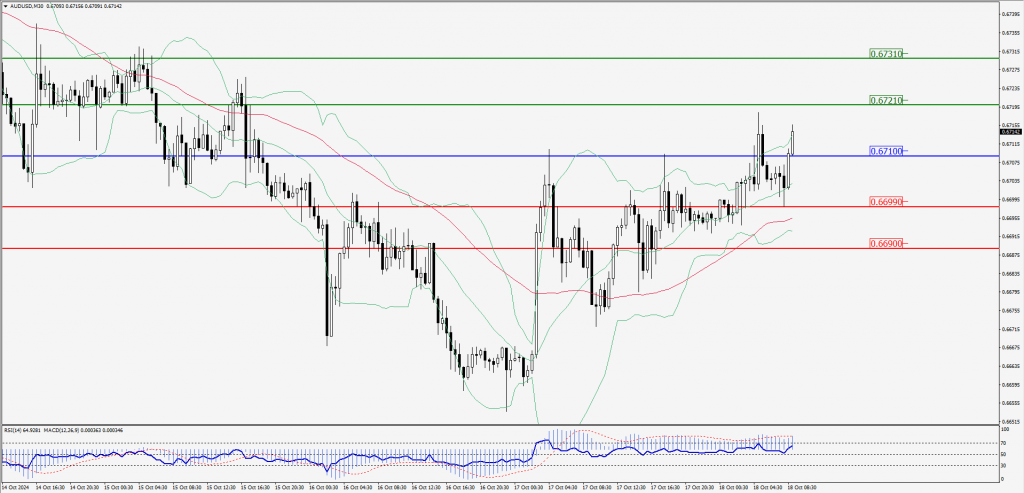
Green Lines Indicate Resistance Levels – Red Lines Indicate Support Levels
Light Blue is a Pivot Point – Black represents the price when the report was produced
CRUDEOIL Intraday: Support level at 70.41
Our pivot point is at 70.41
Preferable Price Action: Above pivot buy oil with 71.08 & 71.68 as targets.
Alternative Price Action: Sell crude below pivot with targets at 69.77 & 69.21 in extension.
Comment: RSI is at above 50 levels and pairs above its 20MA & 55MA.
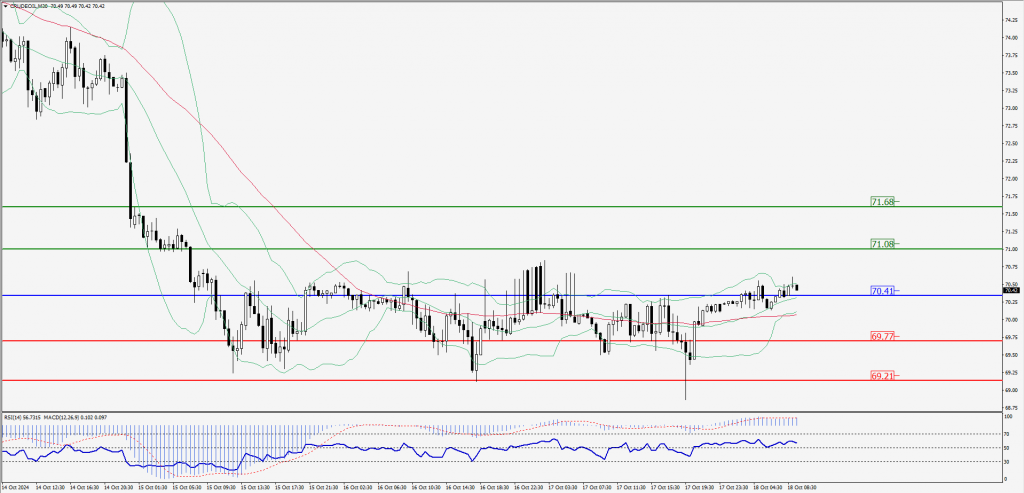
Green Lines Indicate Resistance Levels – Red Lines Indicate Support Levels
Light Blue is a Pivot Point – Black represents the price when the report was produced
XAU/USD Intraday: Trend on the upside
Our pivot point is at 2703.90
Preferable Price Action: Further upside to 2713.90 and 2721.60.
Alternative Price Action: If the price gives an upside breakout of a pivot, then the price extends to 2694.30 and 2685.80.
Comment: MACD is above 50 levels and pairs above its 55MA & 20MA.
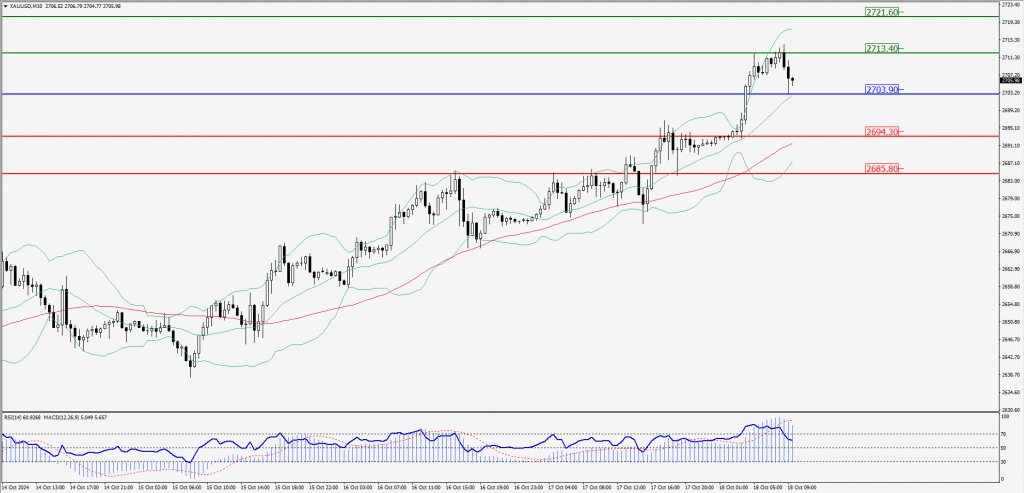
Green Lines Indicate Resistance Levels – Red Lines Indicate Support Levels
Light Blue is a Pivot Point – Black represents the price when the report was produced
Dow Jones Intraday: Trend on the downside
Our pivot point is 43,233.90
Preferable Price Action: Take sell positions above the pivot with targets at 43,159.00 & 43,088.40.
Alternative Price Action: Below 43,233.90 looks for further upside to 43,307.70 & 43,379.40.
Comment: RSI is below 50 levels and pairs below its 20MA.
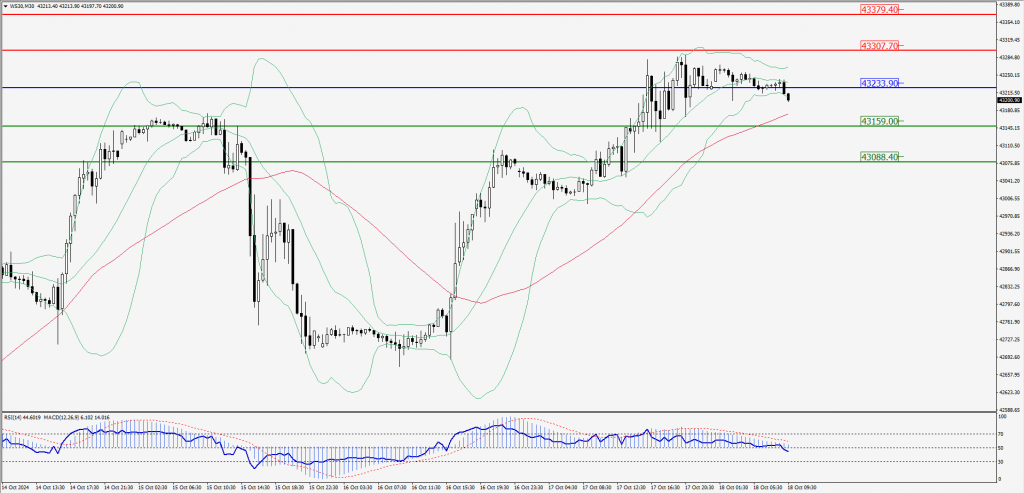
Green Lines Indicate Resistance Levels – Red Lines Indicate Support Levels
Light Blue is a Pivot Point – Black represents the price when the report was produced