Market Wrap: Stocks, Bonds, Commodities
Most Asian currencies weakened on Tuesday, while the dollar steadied at an over two-month high amid persistent bets that the Federal Reserve will cut interest rates at a slower pace.
The Dow Jones Industrial Average rose 201.36 points to 43,065.22, the S&P 500 gain 0.77% to 5,859.85 and the Nasdaq Composite ascend 159.75 points to 18,502.69.
MSCI’s index of Asia-Pacific stocks outside Japan is down 0.08% to 748.86 levels. The Australian index was higher by 0.79% to 8,315.40. Japanese Nikkei Index increase 0.87% today.
European stocks were mixed on Monday, with the Stoxx Europe 50 Index increase 0.08% to 5,044.95 Germany’s DAX ascend 0.42% to 19,583.95, and France’s CAC lower 0.10% to 7,594.50 and U.K.’s FTSE 100 loss 0.11% to 8,283.33.
Benchmark 10-year U.S. Treasury fail as demand for safe assets slipped again, today 10-year bond yields 1.07% to 4.0810.
Oil prices fell sharply in Asian trade on Tuesday, extending recent losses amid growing concerns over a demand slowdown, while a report suggesting that Israel will not attack Iranian oil facilities also weighed.
Spot Brent crude oil decrease 3.58% to $74.69 per barrel. US West Texas Intermediate crude is decrease 3.68% to $71.11 a barrel.
The yellow metal gold is up 0.02% to 2,666.10 dollars per ounce.
Market Wrap: Forex
The U.S. dollar was perched at an over two-month high against major currencies on Tuesday, spurred by wagers the Federal Reserve will proceed with modest rate cuts in the near term, pinning the yen closer to the key 150 per dollar level.
Today, the U.S. dollar index measures the Greenback against a trade-weighted basket of six major currencies, which decrease 0.01% to 103.070.
The Euro US Dollar (EUR/USD) is a widely traded is down 0.18% today. This left the pair trading around $1.08890.
The Japanese yen was will move positive against the U.S. dollar on Monday. Today USD/JPY is trades pair that decrease 0.34% to the 149.250 level.
Another commodity-related currency negative against the U.S dollar, AUD/USD loss 0.16% to 0.67140, and NZD/USD decrease 0.21% to 0.60810 level.
EUR/USD Intraday: Trend on the downside
Our pivot point is at 1.08980
Preferable Price Action: Take sell positions below pivot level with targets at 1.08870 & 1.08790 in extension.
Alternative Price Action: Buy pivot looks for a further upside to 1.09080 & 1.09170.
Comment: RSI is below 50 levels and pairs below its 55MA & 20MA.
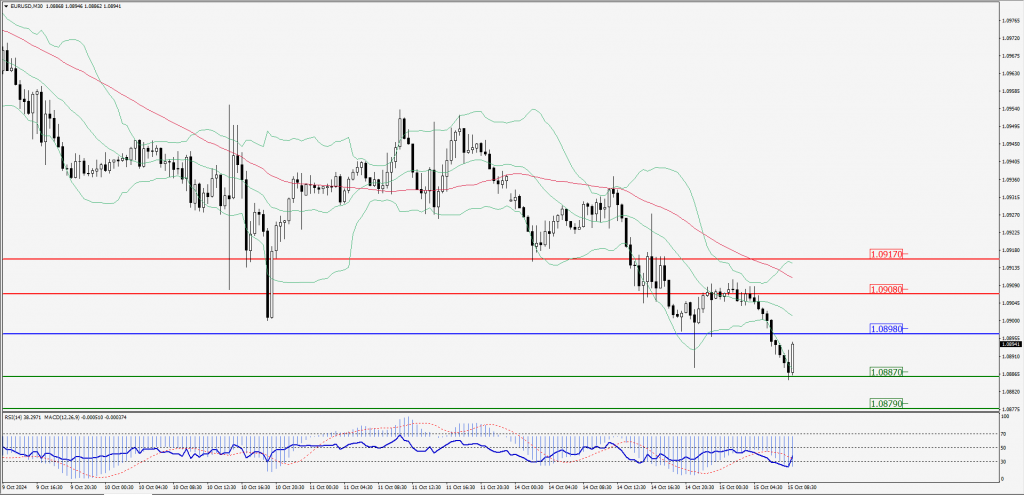
Green Lines Indicate Resistance Levels – Red Lines Indicate Support Levels
Light Blue is a Pivot Point – Black represents the price when the report was produced
GBP/USD Intraday: Resistance level at 1.30570
Our pivot point is at 1.30570
Preferable Price Action: Sell positions below pivot with targets at 1.30470 & 1.30390 in extension.
Alternative Price Action: The price above pivot would call for further upside to 1.30660 & 1.30750.
Comment: RSI is below 50 levels and pairs below its 20MA & 55MA.
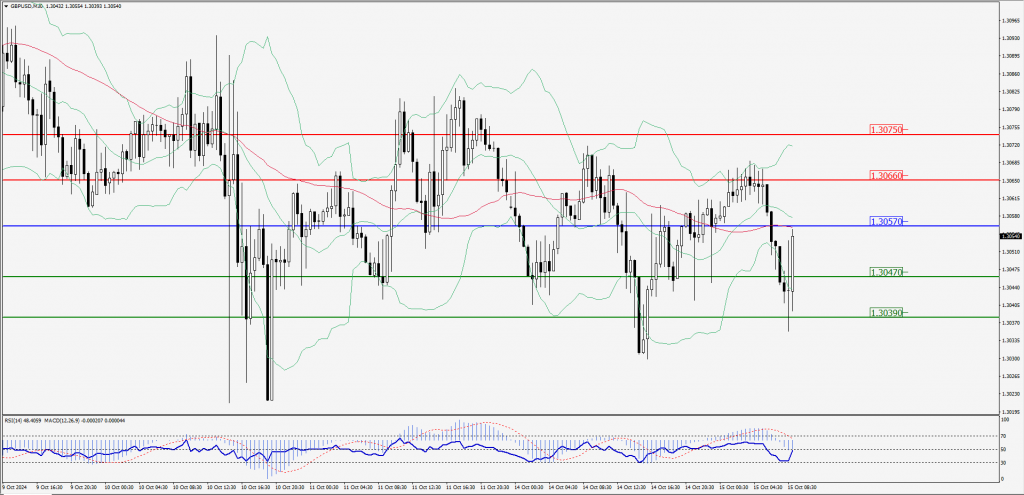
Green Lines Indicate Resistance Levels – Red Lines Indicate Support Levels
Light Blue is a Pivot Point – Black represents the price when the report was produced
USD/JPY Intraday: Trend on the downside
Our pivot point is at 149.530
Preferable Price Action: Sell position below pivot with the target at 149.300 and 149.100 in extension.
Alternative Price Action: The upside breakout of the pivot would call for 149.770 and 149.970.
Comment: MACD is below 50 levels and pairs below its 55MA & 20MA.
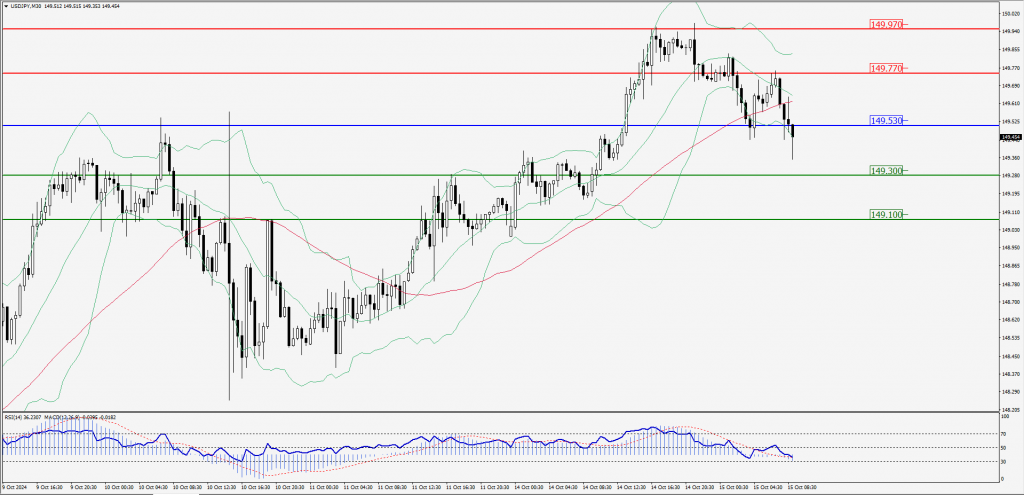
Green Lines Indicate Resistance Levels – Red Lines Indicate Support Levels
Light Blue is a Pivot Point – Black represents the price when the report was produced
AUD/USD Intraday: Trend on the downside
Our pivot point is at 0.67170
Preferable Price Action: Sell positions below pivot with targets at 0.67100 & 0.67030 in extension.
Alternative Price Action: Above pivot a further upside with 0.67240 & 0.67310 as targets.
Comment: RSI is below 50 levels and pairs below its 55MA & 20MA.
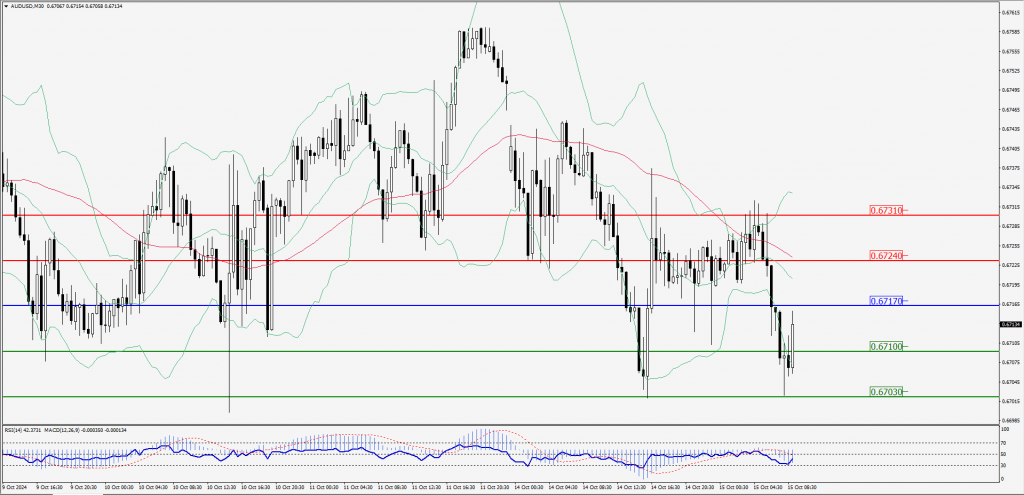
Green Lines Indicate Resistance Levels – Red Lines Indicate Support Levels
Light Blue is a Pivot Point – Black represents the price when the report was produced
CRUDEOIL Intraday: Major trend on the downside
Our pivot point is at 70.89
Preferable Price Action: Below pivot sell oil with 70.12 & 69.56 as targets.
Alternative Price Action: Buy crude above pivot with targets at 71.67 & 72.33 in extension.
Comment: RSI is at below 50 levels and pairs below its 55MA & 20MA.
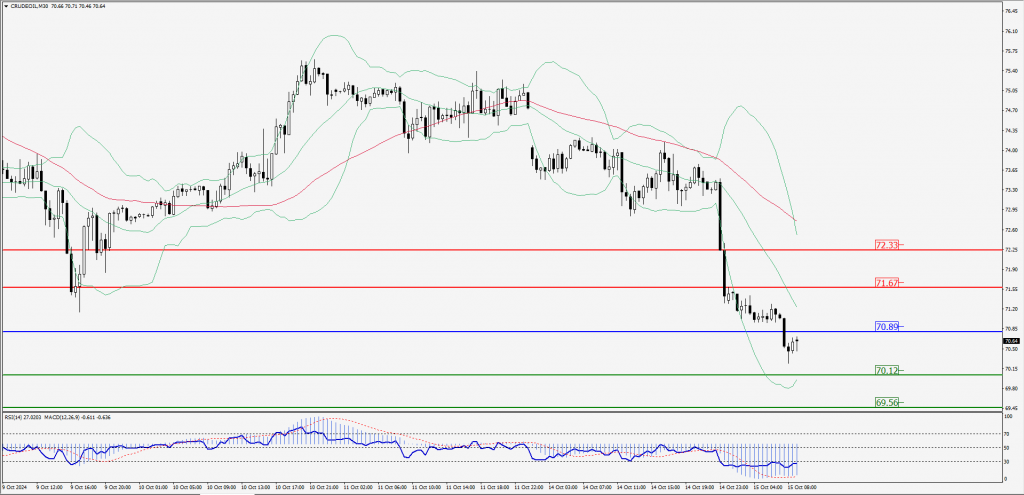
Green Lines Indicate Resistance Levels – Red Lines Indicate Support Levels
Light Blue is a Pivot Point – Black represents the price when the report was produced
XAU/USD Intraday: Trend on the downside
Our pivot point is at 2650.60
Preferable Price Action: Further downside to 2642.30 and 2634.30.
Alternative Price Action: If the price gives an upside breakout of a pivot, then the price extends to 2658.80 and 2666.00.
Comment: MACD is below 50 levels and pairs below its 55MA.
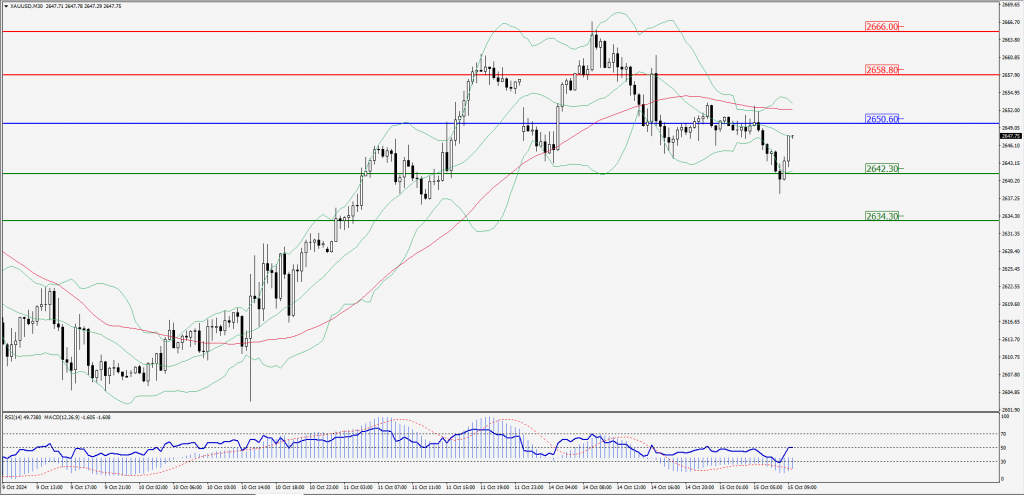
Green Lines Indicate Resistance Levels – Red Lines Indicate Support Levels
Light Blue is a Pivot Point – Black represents the price when the report was produced
Dow Jones Intraday: Trend on the upside
Our pivot point is 43,115.20
Preferable Price Action: Take buy positions above the pivot with targets at 43,274.90 & 43,413.80.
Alternative Price Action: Below 43,115.20 looks for further downside to 42,960.00 & 42,807.30.
Comment: RSI is above 50 levels and pairs above its 55MA.
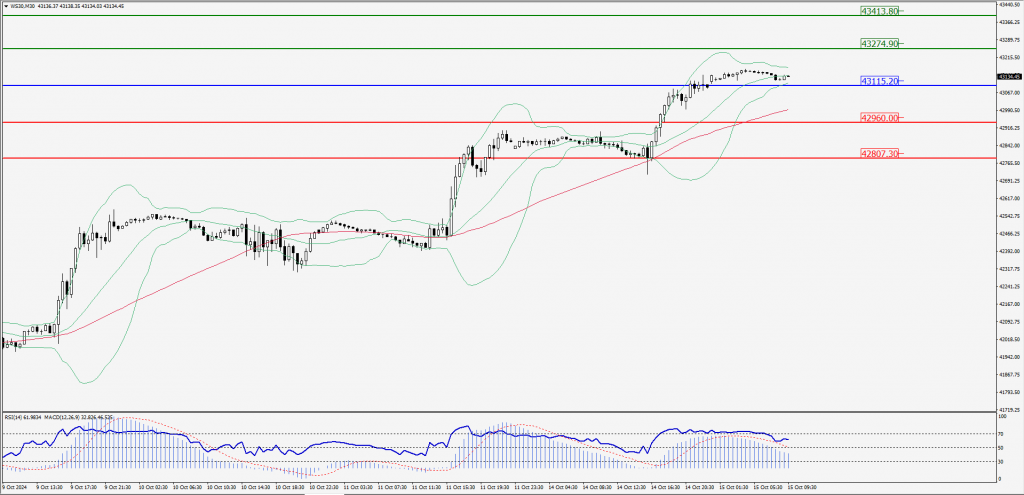
Green Lines Indicate Resistance Levels – Red Lines Indicate Support Levels
Light Blue is a Pivot Point – Black represents the price when the report was produced