Market Wrap: Stocks, Bonds, Commodities
Most Asian currencies moved in a tight range on Monday, while the dollar steadied from recent losses as traders awaited a slew of more cues on the Federal Reserve and U.S. inflation.
The Dow Jones Industrial Average rose 38.17 points to 42,063.36, the S&P 500 loss 0.19% to 5,702.55 and the Nasdaq Composite descend 11.09 points to 17,948.32.
MSCI’s index of Asia-Pacific stocks outside Japan is up 1.23% to 714.09 levels. The Australian index was lower by 0.69% to 8,152.90. Japanese Nikkei Index increase 1.67% today.
European stocks were negative on Monday, with the Stoxx Europe 50 Index decrease 0.30% to 4,918.45 Germany’s DAX descend 0.08% to 18,716.45, and France’s CAC lower 0.51% to 7,462.31 and U.K.’s FTSE 100 loss 0.09% to 8,222.66.
Benchmark 10-year U.S. Treasury rose as demand for safe assets slipped again, today 10-year bond yields 0.33% to 3.7400.
Oil prices rose on Monday, buoyed by concerns that heightened conflict in the Middle East may curtail regional supply and expectations last week’s outsized U.S. interest rate cut will support demand.
Spot Brent crude oil decrease 0.04% to $73.66 per barrel. US West Texas Intermediate crude is decrease 0.27% to $73.66 a barrel.
The yellow metal gold is down 0.07% to 2,644.40 dollars per ounce.
Market Wrap: Forex
The Australian dollar was among the better performers, advancing before a Reserve Bank of Australia meeting where the central bank is likely to strike a hawkish chord.
Today, the U.S. dollar index measures the Greenback against a trade-weighted basket of six major currencies, which increase 0.16% to 100.890.
The Euro US Dollar (EUR/USD) is a widely traded is down 0.37% today. This left the pair trading around $1.11210.
The Japanese yen was will move negative against the U.S. dollar on Monday. Today USD/JPY is trades pair that decrease 0.13% to the 143.720 level.
Another commodity-related currency mixed against the U.S dollar, AUD/USD loss 0.04% to 0.68040, and NZD/USD increase 0.10% to 0.62310 level.
EUR/USD Intraday: Trend on the downside
Our pivot point is at 1.11630
Preferable Price Action: Take sell positions below pivot level with targets at 1.11480 & 1.11350 in extension.
Alternative Price Action: Buy pivot looks for a further upside to 1.11920 & 1.11780.
Comment: RSI is below 50 levels and Pairs below its 55MA.
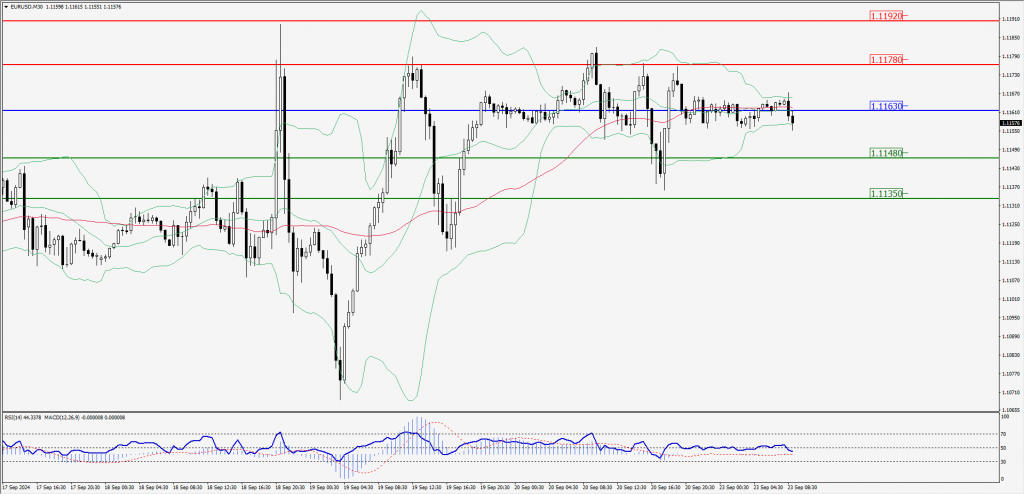
Green Lines Indicate Resistance Levels – Red Lines Indicate Support Levels
Light Blue is a Pivot Point – Black represents the price when the report was produced
GBP/USD Intraday: Trend on the upside
Our pivot point is at 1.33090
Preferable Price Action: Buy positions above pivot with targets at 1.33390 & 1.33650 in extension.
Alternative Price Action: The price below pivot would call for further downside to 1.32810 & 1.32550.
Comment: RSI is above 50 levels and Pairs above its 55MA.
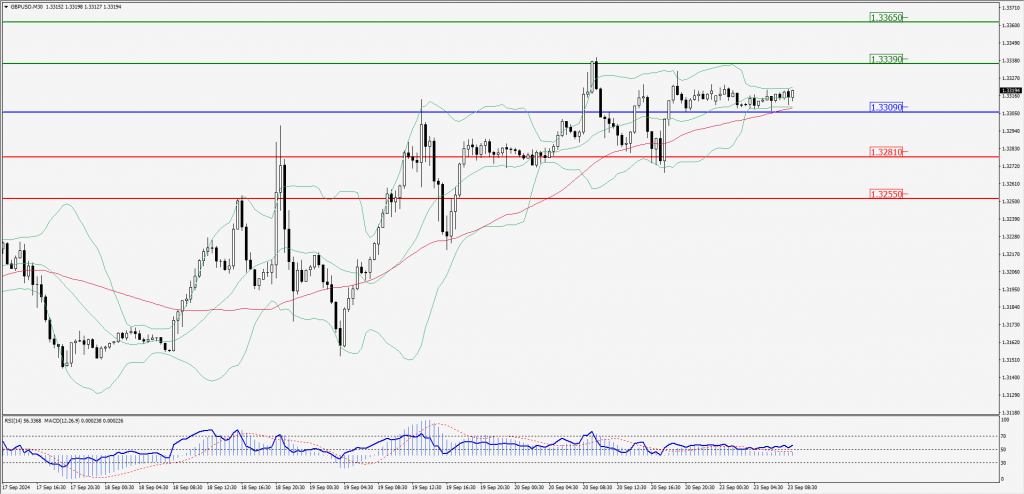
Green Lines Indicate Resistance Levels – Red Lines Indicate Support Levels
Light Blue is a Pivot Point – Black represents the price when the report was produced
USD/JPY Intraday: Trend on the downside
Our pivot point is at 144.170
Preferable Price Action: Sell position below pivot with the target at 143.590 and 143.050 in extension.
Alternative Price Action: The upside breakout of the pivot would call for 144.750 and 145.270.
Comment: MACD is below 50 levels and Pairs below its 20MA.
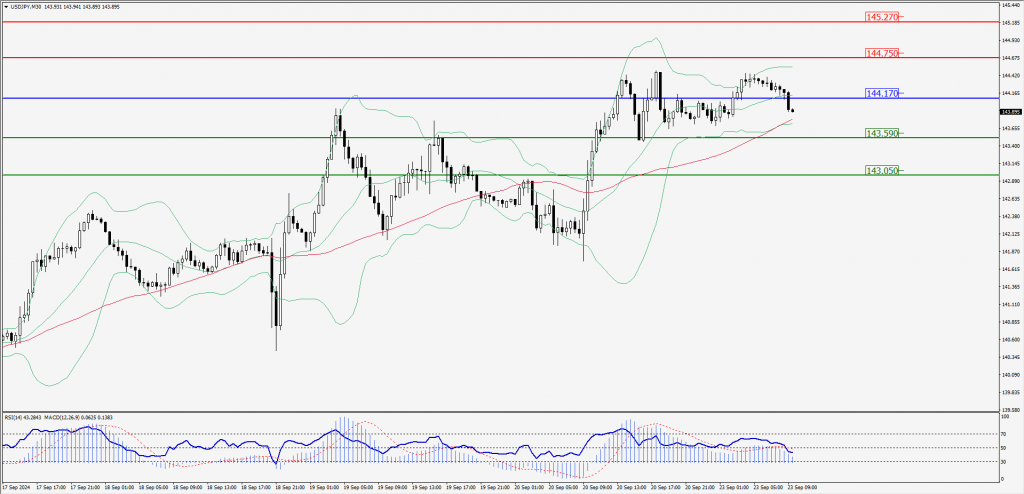
Green Lines Indicate Resistance Levels – Red Lines Indicate Support Levels
Light Blue is a Pivot Point – Black represents the price when the report was produced
AUD/USD Intraday: Trend on the upside
Our pivot point is at 0.68250
Preferable Price Action: Buy positions above pivot with targets at 0.68390 & 0.68530 in extension.
Alternative Price Action: Below pivot a further downside with 0.68110 & 0.67970 as targets.
Comment: RSI is above 50 levels and pairs above its 20MA & 55MA.
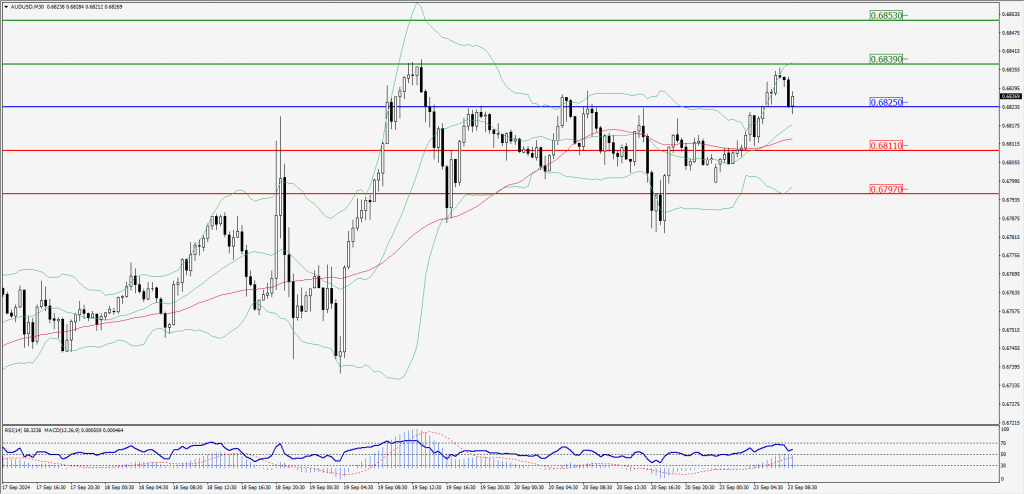
Green Lines Indicate Resistance Levels – Red Lines Indicate Support Levels
Light Blue is a Pivot Point – Black represents the price when the report was produced
CRUDEOIL Intraday: Trend on the upside
Our pivot point is at 71.18
Preferable Price Action: Above pivot buy oil with 71.61 & 72.01 as targets.
Alternative Price Action: Sell crude below pivot with targets at 70.75 and 70.34 in extension.
Comment: RSI is at above 50 levels and pairs above its 20MA & 55MA.
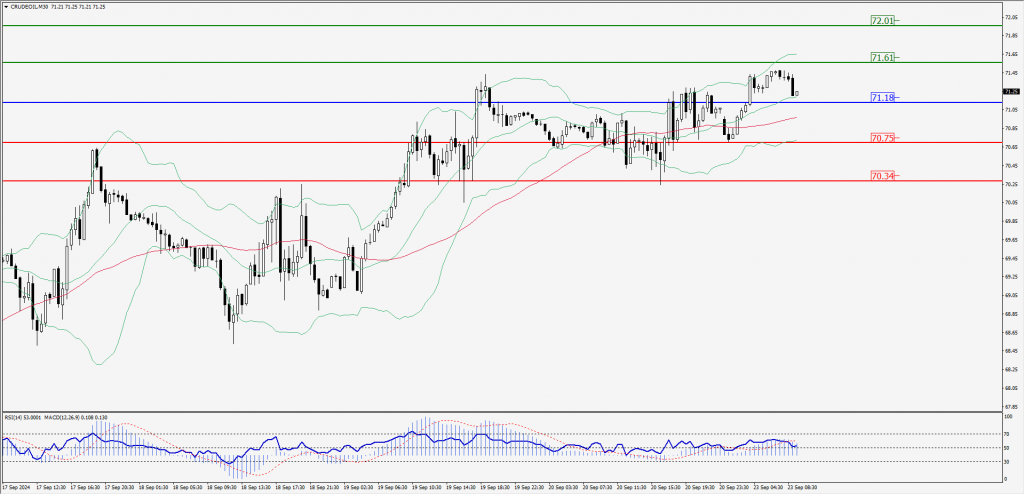
Green Lines Indicate Resistance Levels – Red Lines Indicate Support Levels
Light Blue is a Pivot Point – Black represents the price when the report was produced
XAU/USD Intraday: Trend on the upside
Our pivot point is at 2624.40
Preferable Price Action: Further upside to 2636.40 and 2646.30.
Alternative Price Action: If the price gives an downside breakout of a pivot, then the price extends to 2612.30 and 2602.20.
Comment: MACD is above 50 levels and pairs above its 20MA & 55MA.
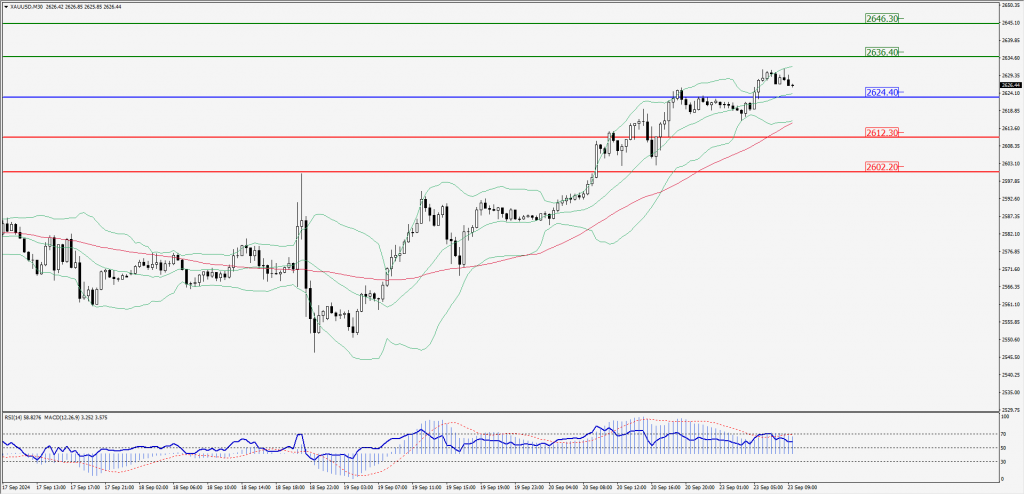
Green Lines Indicate Resistance Levels – Red Lines Indicate Support Levels
Light Blue is a Pivot Point – Black represents the price when the report was produced
Dow Jones Intraday: Trend on the upside
Our pivot point is 42,078.40
Preferable Price Action: Take buy positions above the pivot with targets at 42,172.20 & 42,252.50.
Alternative Price Action: Below 42,078.40 looks for further downside to 41,977.20 & 41,888.30.
Comment: RSI is above 50 levels and pairs above its 55MA.
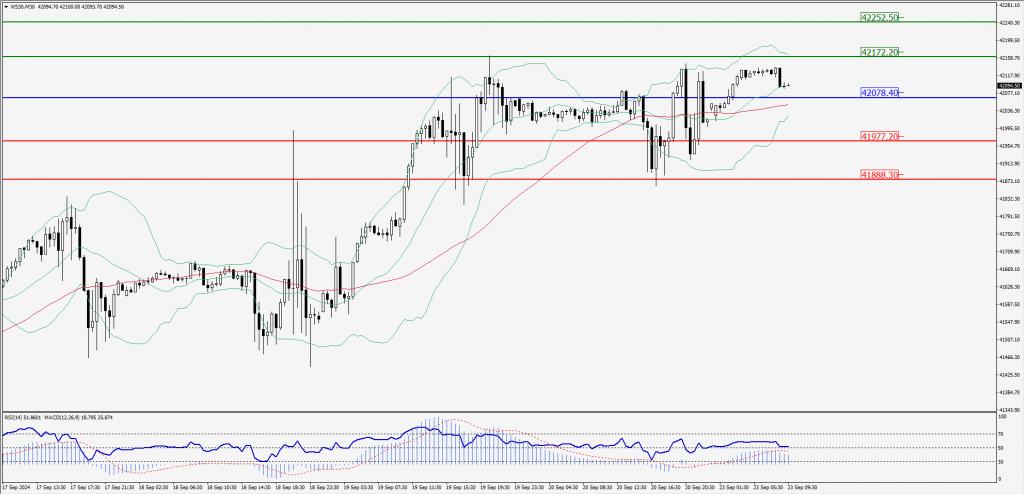
Green Lines Indicate Resistance Levels – Red Lines Indicate Support Levels
Light Blue is a Pivot Point – Black represents the price when the report was produced