Market Wrap: Stocks, Bonds, Commodities
Wall Street’s main indexes closed higher on Monday, with mega cap growth stocks such as Alphabet and Tesla supporting a rebound in technology-heavy Nasdaq while investors also waited anxiously for the U.S. Federal Reserve’s meeting this week.
The Dow Jones Industrial Average rose 75.66 points to 38,790.43, the S&P 500 gain 0.63% to 5,149.42 and the Nasdaq Composite surged 130.27 points to 16,103.45.
MSCI’s index of Asia-Pacific stocks outside Japan is decline 1.01% to 647.63 levels. The Australian index was higher by 0.36% to 7,703.20. Japanese Nikkei Index ascend 0.66% today.
European stocks were positive on Tuesday, with the Stoxx Europe 50 Index rose 0.02% to 4,983.65, Germany’s DAX ascend 0.06% to 17,948.59, and France’s CAC advance 0.01% to 8,149.29 and U.K.’s FTSE 100 add 0.08% to 7,727.94.
Benchmark 10-year U.S. Treasury fell as demand for safe assets drop again, today 10-year bond yields negative 0.39% to 4.3230.
Oil prices climbed about 1% to a four-month high on Monday on lower crude exports from Iraq and Saudi Arabia and signs of stronger demand and economic growth in China and the U.S.
Spot Brent crude oil drop 0.22% to $86.70 per barrel. US West Texas Intermediate crude is down 0.19% to $82.00 a barrel.
The yellow metal gold is decline 0.51% to 2,153.15 dollars per ounce.
Market Wrap: Forex
The dollar edged higher on Monday ahead of a slew of central bank meetings this week, with the Bank of Japan potentially set to end negative interest rates and the market waiting for the Federal Reserve’s latest projections for its rate cut plans.
Today, the U.S. dollar index measures the Greenback against a trade-weighted basket of six major currencies, which surged 0.34% to 103.585.
The Euro US Dollar (EUR/USD) is a widely traded pair that is down 0.23% today. This left the pair trading around $1.08450.
The Japanese yen was positive against the U.S. dollar on Tuesday. Today USD/JPY is surged 0.85% to the 150.410 level.
Another commodity-related currency negative against the U.S dollar, AUD/USD fell 0.72% to 0.65120, and NZD/USD slipped 0.63% to 0.60440 level.
EUR/USD Intraday: Trend on the downside
Our pivot point is at 1.08710
Preferable Price Action: Take sell positions below pivot level with targets at 1.08540 & 1.08410 in extension.
Alternative Price Action: above pivot looks for a further upside to 1.08900 & 1.09050.
Comment: RSI is below 50 levels and pairs below its 20MA & 55MA.
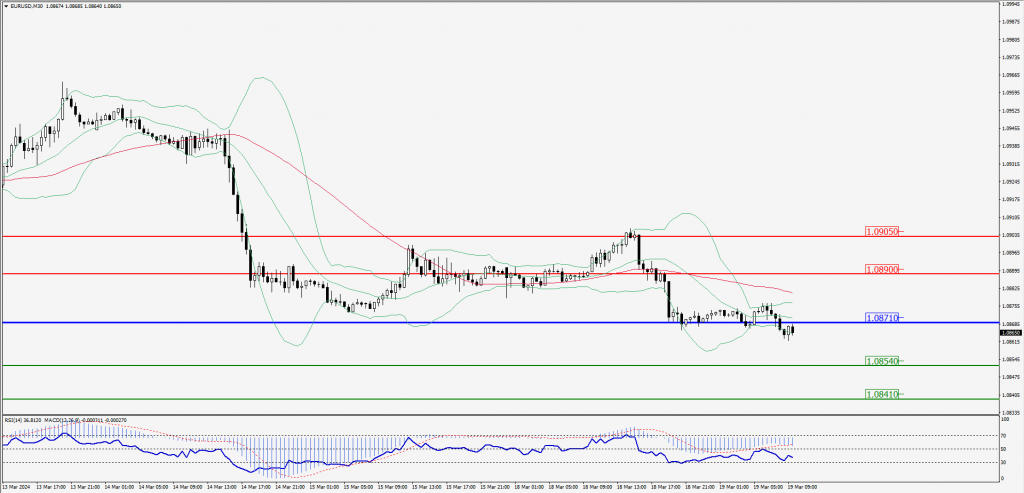
Green Lines Indicate Resistance Levels – Red Lines Indicate Support Levels
Light Blue is a Pivot Point – Black represents the price when the report was produced
GBP/USD Intraday: Trend on the downside
Our pivot point is at 1.27150
Preferable Price Action: Sell positions below pivot with targets at 1.26890 & 1.26720 in extension.
Alternative Price Action: The price above pivot would call for further upside to 1.27400 & 1.27600.
Comment: RSI is below 50 levels and pairs below its 20MA & 55MA.

Green Lines Indicate Resistance Levels – Red Lines Indicate Support Levels
Light Blue is a Pivot Point – Black represents the price when the report was produced
USD/JPY Intraday: Major trend on the upside
Our pivot point is at 150.250
Preferable Price Action: Buy position above pivot with the target at 150.790 and 151.170 in extension.
Alternative Price Action: The downside breakout of the pivot would call for 149.660 and 149.210.
Comment: MACD is above 50 levels and Pairs above its 20MA & 55MA.

Green Lines Indicate Resistance Levels – Red Lines Indicate Support Levels
Light Blue is a Pivot Point – Black represents the price when the report was produced
AUD/USD Intraday: Major trend on the downside
Our pivot point is at 0.65220
Preferable Price Action: Sell positions below pivot with targets at 0.65020 & 0.64870 in extension.
Alternative Price Action: Above pivot looks for a further upside with 0.65420 & 0.65590 as targets.
Comment: RSI is below 50 levels and pairs below its 20MA & 55MA.

Green Lines Indicate Resistance Levels – Red Lines Indicate Support Levels
Light Blue is a Pivot Point – Black represents the price when the report was produced
CRUDEOIL Intraday: Trend on the upside
Our pivot point is at 81.88
Preferable Price Action: Above pivot buy oil with 82.68 & 83.27 as targets.
Alternative Price Action: Sell crude below pivot with targets at 81.11 and 80.48 in extension.
Comment: MACD is positive territory and Pairs above 55MA.

Green Lines Indicate Resistance Levels – Red Lines Indicate Support Levels
Light Blue is a Pivot Point – Black represents the price when the report was produced
XAU/USD Intraday: Trend on the downside
Our pivot point is 2158.70
Preferable Price Action: Further downside to 2151.70 and 2146.50.
Alternative Price Action: If the price gives an upside breakout of a pivot, then the price extends to 2165.60 and 2171.00.
Comment: MACD is below 50 level and Pairs below its 20MA & 55MA

Green Lines Indicate Resistance Levels – Red Lines Indicate Support Levels
Light Blue is a Pivot Point – Black represents the price when the report was produced
Dow Jones Intraday: In a consolidation zone
Our pivot point is 38,781.00
Preferable Price Action: Take buy positions above the pivot with targets at 38,868.80 & 38,941.00.
Alternative Price Action: Below 38,781.00 looks for further downside to 38,687.10 & 38,621.90.
Comment: RSI is at 50 levels.

Green Lines Indicate Resistance Levels – Red Lines Indicate Support Levels
Light Blue is a Pivot Point – Black represents the price when the report was produced