Market Wrap: Stocks, Bonds, Commodities
S&P 500 futures were little changed Thursday night as investors looked to extend November’s hot streak.
The Dow Jones Industrial Average fell 220.33 points to 33,897.94, the S&P 500 lose 0.81% to 4,347.35 and the Nasdaq Composite subtract 128.97 points to 13,521.45.
MSCI’s index of Asia-Pacific stocks outside Japan is decline 0.21% to 620.05 levels. The Australian index was higher by 0.55% to 6,976.50. Japanese Nikkei Index drop 0.16% today.
European stocks were positive on Thursday, with the Stoxx Europe 50 Index rose 1.24% to 4,230.25, Germany’s DAX ascend 0.81% to 15,352.54, and France’s CAC advance 1.11% to 7,112.67 and U.K.’s FTSE 100 add 0.73% to 7,455.46.
Benchmark 10-year U.S. Treasury fell as demand for safe assets ascend again, today 10-year bond yields negative 0.19% to 4.6240.
Oil prices dipped on Thursday amid signs the United States, the world’s biggest oil producer, is at peak production, offsetting positive crude demand signals from top consumer China.
Spot Brent crude oil ascend 0.51% to $80.43 per barrel. US West Texas Intermediate crude is up 0.42% to $76.06 a barrel.
The yellow metal gold is decline 0.47% to 1,960.75 dollars per ounce.
Market Wrap: Forex
The dollar gained on Wednesday after still strong U.S. retail sales fell less than expected in October, a reminder for the market that a definitive date for the Federal Reserve to cut interest rates is still unknown.
Today, the U.S. dollar index measures the Greenback against a trade-weighted basket of six major currencies, which surged 0.03% to 105.810.
The Euro US Dollar (EUR/USD) is a widely traded pair that is down 0.03% today. This left the pair trading around $1.06610.
The Japanese yen was negative against the U.S. dollar on Thursday. Today USD/JPY is surged 0.07% to the 151.440 level.
Another commodity-related currency mixed against the U.S dollar, AUD/USD fell 0.05% to 0.63610, and NZD/USD surged 0.07% to 0.58970 level.
EUR/USD Intraday: Trend on the downside
Our pivot point is at 1.08560
Preferable Price Action: Take sell positions below pivot level with targets at 1.08230 & 1.08060 in extension.
Alternative Price Action: Above pivot looks for a further upside to 1.08870 & 1.09080.
Comment: RSI is below 50 levels and Pairs below its 20MA & 55MA.

Green Lines Indicate Resistance Levels – Red Lines Indicate Support Levels
Light Blue is a Pivot Point – Black represents the price when the report was produced
GBP/USD Intraday: Trend on the downside
Our pivot point is at 1.24150
Preferable Price Action: Sell positions below pivot with targets at 1.23600 & 1.23270 in extension.
Alternative Price Action: The price above pivot would call for further upside to 1.24650 & 1.25010.
Comment: RSI is below 50 levels and Pairs below 55MA.

Green Lines Indicate Resistance Levels – Red Lines Indicate Support Levels
Light Blue is a Pivot Point – Black represents the price when the report was produced
USD/JPY Intraday: Trend on the upside
Our pivot point is at 151.270
Preferable Price Action: Buy position above pivot with the target at 151.650 and 151.910 in extension.
Alternative Price Action: The downside breakout of the pivot would call for 151.990 and 150.800.
Comment: MACD is above 50 level and Pairs above its 20MA & 55MA.

Green Lines Indicate Resistance Levels – Red Lines Indicate Support Levels
Light Blue is a Pivot Point – Black represents the price when the report was produced
AUD/USD Intraday: Trend on the downside
Our pivot point is at 0.64930
Preferable Price Action: Sell positions below pivot with targets at 0.64590 & 0.64360 in extension.
Alternative Price Action: Above pivot looks for a further upside with 0.65230 & 0.65440 as targets.
Comment: RSI is below 50 levels and Pairs below its 20MA & 55MA.
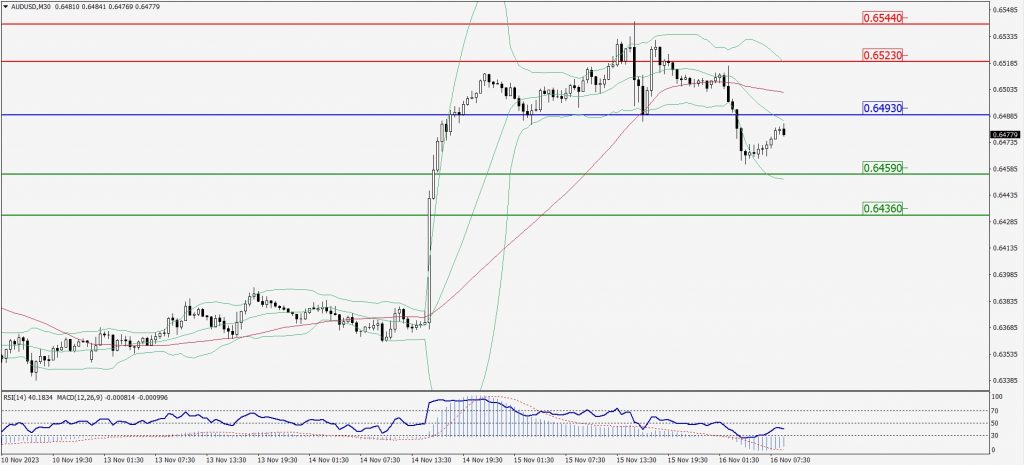
Green Lines Indicate Resistance Levels – Red Lines Indicate Support Levels
Light Blue is a Pivot Point – Black represents the price when the report was produced
CRUDEOIL Intraday: Trend on the downside
Our pivot point is at 76.78
Preferable Price Action: Below pivot sell oil with 75.80 & 75.11 as targets.
Alternative Price Action: Buy crude above pivot with targets at 77.60 and 78.25 in extension.
Comment: MACD is negative territory and Pairs below 55MA.

Green Lines Indicate Resistance Levels – Red Lines Indicate Support Levels
Light Blue is a Pivot Point – Black represents the price when the report was produced
XAU/USD Intraday: Support level at 1963.00
Our pivot point is 1963.00
Preferable Price Action: Further upside to 1974.50 and 1983.40.
Alternative Price Action: If the price gives a downside breakout of a pivot, then the price extends to 1953.20 and 1946.10.
Comment: MACD is above 50 level and Pairs above its 20MA & 55MA.

Green Lines Indicate Resistance Levels – Red Lines Indicate Support Levels
Light Blue is a Pivot Point – Black represents the price when the report was produced
Dow Jones Intraday: In a consolidation zone
Our pivot point is 34,888.00
Preferable Price Action: Take buy positions above the pivot with targets at 35,159.00 & 35,326.00.
Alternative Price Action: Below 34,888.00 looks for further downside to 34,694.00 & 34,532.00.
Comment: RSI is above 50 levels and Pairs above 55MA.

Green Lines Indicate Resistance Levels – Red Lines Indicate Support Levels
Light Blue is a Pivot Point – Black represents the price when the report was produced