Market Wrap: Stocks, Bonds, Commodities
The U.S. dollar edged lower in early European trade Monday, falling to a six-week low and extending last week’s declines on the back of a less hawkish stance from the Federal Reserve.
The Dow Jones Industrial Average rose 222.24 points to 34,061.32, the S&P 500 gain 0.94% to 4,358.34 and the Nasdaq Composite add 184.09 points to 13,478.28.
MSCI’s index of Asia-Pacific stocks outside Japan is advance 2.49% to 614.58 levels. The Australian index was higher by 0.28% to 6,997.40. Japanese Nikkei Index ascend 2.33% today.
European stocks were negative on Monday, with the Stoxx Europe 50 Index fell 0.02% to 4,174.65, Germany’s DAX drop 0.10% to 15,174.05, and France’s CAC decline 0.07% to 7,042.39 and U.K.’s FTSE 100 subtract 0.02% to 7,417.50.
Benchmark 10-year U.S. Treasury fell as demand for safe assets ascend again, today 10-year bond yields positive 0.64% to 4.5860.
Oil prices settled more than 2% lower on Friday as supply concerns driven by Middle East tensions eased, while jobs data raised expectations the U.S. Federal Reserve could be done hiking interest rates in the biggest oil consuming economy.
Spot Brent crude oil ascend 1.40% to $86.08 per barrel. US West Texas Intermediate crude is up 1.59% to $81.80 a barrel.
The yellow metal gold is decline 0.31% to 1,993.15 dollars per ounce.
Market Wrap: Forex
The dollar fell to a six-week low on Friday after data showed the world’s largest economy created fewer jobs than expected last month, reinforcing expectations the Federal Reserve is likely to hold interest rates steady again at its December meeting.
Today, the U.S. dollar index measures the Greenback against a trade-weighted basket of six major currencies, which slipped 0.09% to 104.760.
The Euro US Dollar (EUR/USD) is a widely traded pair that is up 0.17% today. This left the pair trading around $1.07490.
The Japanese yen was negative against the U.S. dollar on Monday. Today USD/JPY is surged 0.10% to the 149.460 level.
Another commodity-related currency mixed against the U.S dollar, AUD/USD rose 0.05% to 0.65140, and NZD/USD slipped 0.05% to 0.59960 level.
EUR/USD Intraday: Trend on the upside
Our pivot point is at 1.07260
Preferable Price Action: Take buy positions above pivot level with targets at 1.07800 & 1.08130 in extension.
Alternative Price Action: Below pivot looks for a further downside to 1.06820 & 1.06550.
Comment: RSI is above 50 levels and Pairs above its 20MA & 55MA.

Green Lines Indicate Resistance Levels – Red Lines Indicate Support Levels
Light Blue is a Pivot Point – Black represents the price when the report was produced
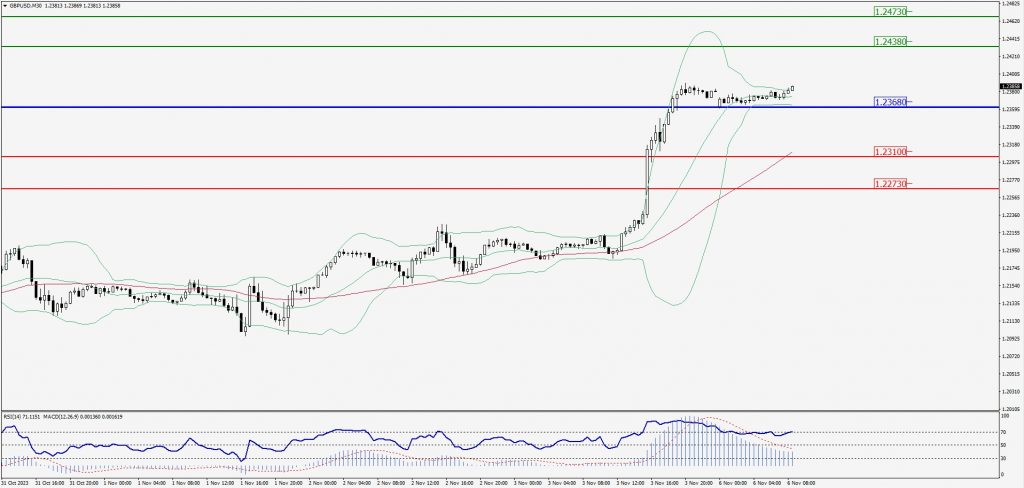
GBP/USD Intraday: Trend on the upside
Our pivot point is at 1.23680
Preferable Price Action: Buy positions above pivot with targets at 1.24380 & 1.24730 in extension.
Alternative Price Action: The price below pivot would call for further downside to 1.23100 & 1.22730.
Comment: RSI is above 50 levels and Pairs above its 20MA & 55MA.
Green Lines Indicate Resistance Levels – Red Lines Indicate Support Levels
Light Blue is a Pivot Point – Black represents the price when the report was produced
USD/JPY Intraday: Resistance level at 149.730
Our pivot point is at 149.730
Preferable Price Action: Sell position below pivot with the target at 149.090 and 148.600 in extension.
Alternative Price Action: The upside breakout of the pivot would call for 150.240 and 150.640.
Comment: MACD is below 50 level and Pairs below 55MA.

Green Lines Indicate Resistance Levels – Red Lines Indicate Support Levels
Light Blue is a Pivot Point – Black represents the price when the report was produced
AUD/USD Intraday: Support level at 0.65060
Our pivot point is at 0.65060
Preferable Price Action: Buy positions above pivot with targets at 0.65460 & 0.65750 in extension.
Alternative Price Action: Below pivot looks for a further downside with 0.64710 & 0.64440 as targets.
Comment: RSI is above 50 levels and Pairs above 55MA.

Green Lines Indicate Resistance Levels – Red Lines Indicate Support Levels
Light Blue is a Pivot Point – Black represents the price when the report was produced
CRUDEOIL Intraday: Trend on the downside
Our pivot point is at 81.28
Preferable Price Action: Below pivot sell oil with 80.23 & 79.58 as targets.
Alternative Price Action: Sell crude below pivot with targets at 82.10 and 82.83 in extension.
Comment: MACD is negative territory and Pairs below 55MA.

Green Lines Indicate Resistance Levels – Red Lines Indicate Support Levels
Light Blue is a Pivot Point – Black represents the price when the report was produced
XAU/USD Intraday: Trend on the downside
Our pivot point is 1986.50
Preferable Price Action: Further downside to 1979.30 and 1974.50.
Alternative Price Action: If the price gives an upside breakout of a pivot, then the price extends to 1991.50 and 1995.80.
Comment: MACD is below 50 level and Pairs below its 20MA & 55MA.

Green Lines Indicate Resistance Levels – Red Lines Indicate Support Levels
Light Blue is a Pivot Point – Black represents the price when the report was produced
Dow Jones Intraday: Trend on the upside
Our pivot point is 34,051.00
Preferable Price Action: Take buy positions above the pivot with targets at 34,327.00 & 34,496.00.
Alternative Price Action: Below 34,051.00 looks for further downside to 33,827.00 & 33,667.00.
Comment: RSI is above 50 levels and Pairs above 55MA.

Green Lines Indicate Resistance Levels – Red Lines Indicate Support Levels
Light Blue is a Pivot Point – Black represents the price when the report was produced